


Top 100 Private | Food Service | Grocery | Beverage | Petroleum/Chemical | Industrial Gases | Agriculture/Food Processing | Wholesale/Retail | Manufacturing
Equipment Rental | Building Materials | Waste Management | Paper/Office Products | Construction | Health Care | Uniform Rental | Media & Entertainment
| Rank This Year | Rank Last Year | Company | Tractors | Trucks | Pickups/ Cargo Vans | Trailers | Annual Revenue |
|---|---|---|---|---|---|---|---|
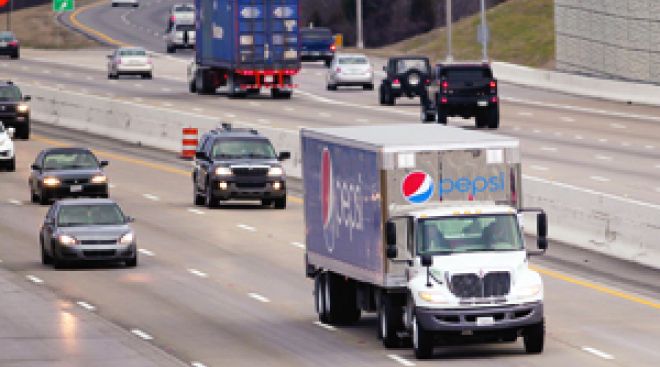
| 1 | 1 | PepsiCo Inc. |
9,950 | 14,304 | - | 16,102 | $63.1 billion |
| 2 | 2 | Sysco Corp. |
8,391 | 1,404 | 355 | 10,320 | $48.7 billion |
| 3 | 3 | Wal-Mart Stores |
6,277 | 199 | - | 66,191 | $482.1 billion |
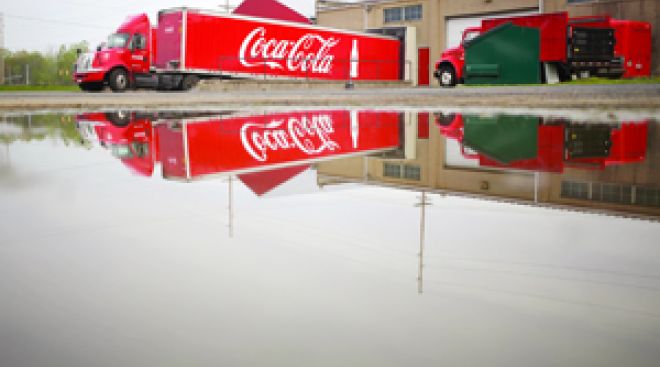
| 4 | 4 | Coca-Cola Co. |
5,664 | 1,054 | - | 7,465 | $44.3 billion |
| 5 | 5 | Halliburton Co. |
5,637 | 1,160 | - | 9,509 | $23.6 billion |
| 6 | 6 | U.S. Foods |
5,242 | 354 | - | 6,530 | $23.0 billion |
| 7 | 10 | Schlumberger Limited |
3,994 | 1,314 | - | 4,770 | $35.5 billion |
| 8 | 8 | Reyes Holdings |
3,936 | 616 | 536 | 4,782 | $24.0 billion |
| 9 | 7 | Agrium Inc. |
3,930 | 2,315 | 7,457 | 6,297 | $14.8 billion |
| 10 | 9 | McLane Co. |
3,837 | 305 | 9 | 5,283 | $48.0 billion |
| 11 | 11 | C & J Energy Services |
2,970 | 1,661 | - | 4,580 | $1.7 billion |
| 12 | 13 | Performance Food Group |
2,814 | 132 | - | 3,500 | $11.7 billion |
| 13 | 15 | Dr Pepper Snapple Group |
2,293 | 87 | 1,165 | 2,902 | $6.4 billion |
| 14 | 16 | Baker Hughes |
2,282 | 1,813 | - | 2,856 | $15.7 billion |
| 15 | 18 | Dean Foods Co. |
2,135 | 2,752 | 422 | 5,239 | $8.1 billion |
| 16 | 12 | Tyson Foods |
2,122 | 59 | - | 6,105 | $40.6 billion |
| 17 | Femsa Logistica |
1,920 | - | - | 2,308 | $0.8 billion |
|
| 18 | 19 | Gordon Food Service |
1,787 | 36 | - | 2,453 | - |
| 19 | 70 | American Air Liquide Holdings |
1,754 | 4,117 | - | 3,126 | - |
| 20 | 21 | Basic Energy Services |
1,620 | 386 | - | 1,819 | $0.8 billion |
| 21 | 22 | Kroger Co. |
1,557 | 35 | - | 5,826 | $109.8 billion |
| 22 | 26 | Albertsons |
1,497 | - | - | 6,021 | - |
| 23 | 23 | United Rentals Inc. |
1,420 | 2,204 | - | 1,484 | $5.8 billion |
| 24 | 14 | CHS Inc. |
1,376 | 2,148 | - | 2,154 | $34.6 billion |
| 25 | 17 | Clean Harbors Inc. |
1,347 | 4,662 | - | 3,109 | $3.3 billion |
| 26 | 25 | Gibson Energy Inc. |
1,300 | - | - | 2,500 | $5.6 billion |
| 27 | 29 | Dot Foods |
1,290 | 4 | 17 | 1,970 | - |
| 28 | 44 | Calfrac Well Services |
1,270 | 568 | - | 2,097 | $1.5 billion |
| 29 | 28 | Helena Chemical Co. |
1,172 | 1,932 | - | 2,575 | - |
| 30 | 20 | Weatherford International |
1,136 | 605 | - | 3,297 | $9.4 billion |
| 31 | 30 | Praxair Inc. |
1,115 | 1,787 | - | 3,677 | $10.8 billion |
| 32 | 31 | Prairie Farms Dairy |
1,104 | 1,386 | 234 | 2,968 | - |
| 33 | 32 | Pilot Flying J Inc. |
1,032 | - | - | 1,314 | - |
| 34 | 41 | Darling Ingredients |
1,016 | 682 | 355 | 4,141 | $3.4 billion |
| 35 | 35 | Builders FirstSource Inc. |
990 | 2,541 | - | 1,693 | $6.1 billion |
| 35 | 34 | Plains All American Pipeline |
990 | - | - | 1,930 | $23.2 billion |
| 37 | 27 | Key Energy Services |
946 | 998 | - | 949 | $0.8 billion |
| 38 | 39 | Ben E. Keith Co. |
941 | 46 | - | 1,170 | - |
| 39 | 38 | Sunbelt Rentals |
919 | 1,972 | - | 1,058 | $3.3 billion |
| 40 | 33 | Cemex USA |
902 | 3,968 | - | 1,416 | $3.9 billion |
| 41 | 48 | Ahold Delhaize Group |
885 | 661 | - | 3,992 | - |
| 42 | 87 | Coca-Cola Bottling United |
806 | 424 | - | 962 | - |
| 42 | 37 | Veritiv Corp. |
806 | 106 | 117 | 1,274 | $8.7 billion |
| 44 | Southern Glazer's Wine $amp;amp; Spirits |
802 | 2,111 | - | 1,276 | - | |
| 45 | 60 | Food Services of America |
772 | 55 | - | 741 | - |
| 46 | 43 | Walgreen Co. |
754 | 6 | - | 1,848 | $103.4 billion |
| 47 | 52 | United Natural Foods |
747 | 2 | - | 913 | $8.2 billion |
| 48 | 54 | Core-Mark Holding Co. |
745 | 98 | - | 911 | $11.1 billion |
| 49 | 36 | Nestle USA |
735 | 3,205 | - | 1,527 | $9.7 billion |
| 49 | 47 | Univar Inc. |
735 | 97 | 65 | 1,761 | - |
| 51 | 45 | Linde North America |
733 | 2,270 | - | 1,899 | $2.0 billion |
| 52 | 46 | Kellogg Co. |
710 | 60 | - | 1,153 | $13.5 billion |
| 53 | 53 | Ashley Furniture Industries |
709 | 1 | 10 | 3,400 | - |
| 54 | 42 | Shaw Industries Group |
697 | 55 | 238 | 3,233 | - |
| 55 | 65 | Quikrete Companies |
685 | 16 | - | 883 | - |
| 56 | 56 | Mondelez International |
680 | 230 | 50 | 780 | $29.6 billion |
| 57 | 61 | ABC Supply Co. |
633 | 2,400 | 254 | 898 | - |
| 58 | 73 | Energy Transfer Partners |
629 | 120 | - | 740 | $34.3 billion |
| 59 | 55 | Advanced Drainage Systems |
625 | 0 | - | 1,100 | - |
| 60 | 50 | Lowe's Companies Inc. |
624 | 72 | - | 640 | $59.1 billion |
| 61 | 72 | Cudd Energy Services |
619 | 183 | - | 958 | - |
| 62 | Brenntag North America |
612 | 89 | - | 1,513 | $11.5 billion |
|
| 63 | 64 | Maxim Crane Works |
608 | 0 | - | 985 | - |
| 63 | 51 | Nuverra Environmental Solutions |
608 | 223 | - | 873 | $0.4 billion |
| 65 | 63 | Archer Daniels Midland |
602 | 87 | - | 1,702 | $67.7 billion |
| 66 | 58 | Love's Travel Stops |
585 | 2,048 | - | 1,474 | - |
| 67 | 74 | Oldcastle Inc. |
585 | 2,048 | - | 1,474 | - |
| 68 | 62 | Golden State Foods |
580 | 45 | - | 794 | $7.0 billion |
| 69 | 86 | Sherwin-Williams Co. |
571 | 1 | - | 1,548 | $11.3 billion |
| 70 | 59 | JBS USA Holdings |
569 | 0 | - | 1,302 | - |
| 71 | 48 | Perdue Farms Inc. |
567 | 39 | 582 | 1,627 | - |
| 72 | 57 | Publix Super Markets |
562 | 18 | - | 2,696 | $32.4 billion |
| 73 | 69 | MDU Resources Group |
553 | 1,747 | - | 1,718 | $4.2 billion |
| 74 | 40 | Air Products Inc. |
550 | 95 | 420 | 2,000 | $9.9 billion |
| 75 | 80 | SE Independent Delivery Services |
545 | 175 | - | 1,401 | - |
| 76 | 67 | Pilot Thomas Logistics |
542 | 826 | - | 870 | - |
| 77 | 68 | C&S Wholesale Grocers |
541 | 0 | - | 1,434 | $30.0 billion |
| 78 | 76 | Shamrock Foods Co. |
539 | 61 | 75 | 757 | - |
| 79 | 74 | H.E.B. Grocery Co. |
534 | 9 | - | 2,208 | - |
| 80 | 71 | Bunzl Distribution USA |
511 | 66 | 52 | 920 | - |
| 81 | 80 | Foster Farms |
507 | 134 | - | 1,345 | - |
| 82 | Stericycle Inc. |
506 | 3,544 | - | 1,923 | $3.0 billion |
|
| 83 | Swire Coca-Cola USA |
496 | 218 | - | 615 | - | |
| 84 | 94 | KeHE Distributors |
470 | 94 | 40 | 686 | - |
| 85 | 79 | Ace Hardware Corp. |
469 | 1 | - | 1,413 | $4.7 billion |
| 85 | 89 | Sanderson Farms Inc. |
469 | 5 | - | 654 | $2.8 billion |
| 87 | 78 | Pepsi Bottling Ventures |
468 | 146 | 199 | 534 | - |
| 88 | Anheuser-Busch LLC |
452 | 99 | - | 364 | - | |
| 89 | 83 | Supervalu Inc. |
440 | 4 | - | 1,815 | $17.5 billion |
| 90 | 83 | The H.T. Hackney Co. |
438 | 170 | - | 578 | - |
| 91 | 88 | Mohawk Industries |
420 | 138 | - | 2,217 | $8.6 billion |
| 92 | 91 | BlueLinx Holdings |
414 | 14 | - | 644 | $1.9 billion |
| 93 | 98 | J.R. Simplot Co. |
408 | 876 | - | 1,485 | - |
| 93 | 96 | Maines Paper & Food Service |
408 | 58 | - | 506 | $4.0 billion |
| 95 | Select Energy Services |
407 | 193 | - | 1,050 | - | |
| 96 | 83 | Bimbo Bakeries USA |
399 | 3,806 | - | 895 | - |
| 97 | 92 | Hertz Equipment Rental Corp. |
397 | 748 | - | 431 | $1.5 billion |
| 98 | 82 | Sentinel Transportation |
393 | 1 | - | 815 | - |
| 99 | Mobile Mini |
389 | 178 | - | 428 | $0.5 billion |
|
| 100 | 93 | Valley Proteins Inc. |
385 | 94 | 40 | 1,075 | - |
The Top 100 Private Carriers Companies on this list operate their own trucks to carry freight and are ranked on the basis of the total number of highway tractors in the fleet. To be included in the Top 100 list, please send contact information to tteditor@ttnews.com. We will contact you via phone or e-mail to get information about your company prior to publication of the next Top 100 list.

On the Bubble
PepsiCo Lifts Outlook as Drink, Snack Sales Buck Inflation
PepsiCo Inc. said its playbook for battling inflation is still working, with price hikes fueling double-digit gains in sales despite lower volumes of snack purchases.
Volvo, Mack, Tesla Show Gains With BEVs
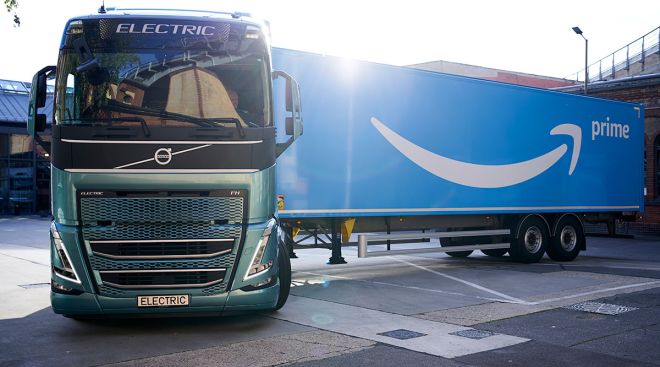
Truck makers both large and small recently announced deals and timetables for more of their battery-electric trucks reaching customers.
Broad Relief Efforts Converge After Hurricane Ian
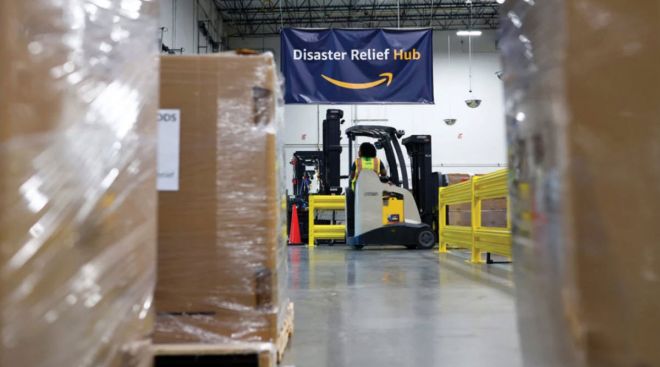
Trucking companies, government entities and nonprofit groups responded to the devastation wrought along Florida’s Gulf Coast by Hurricane Ian last month with relief efforts for the many areas affected by the storm, and are working to overcome challenges in getting aid to those in need.
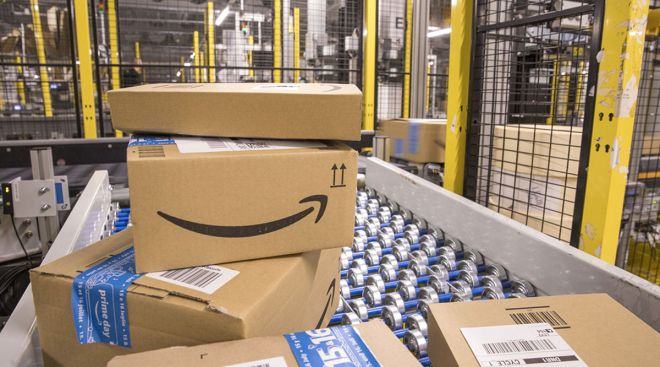
Amazon Plans to Hire 150,000 Workers for Holiday Season
Amazon.com Inc. plans to hire 150,000 seasonal workers, about the same as last year despite slowing sales and predictions of a lackluster holiday shopping season.
Cash Reinvigorates Critical Chicago-Area Transportation Network

CHICAGO — Since as early as 1848, some 12 years before the Civil War, Chicago has been a major center for transportation given its central location in the country, access to newly built railroad lines and the five Great Lakes. Now, more than 170 years later, millions of products pass through its massive transportation network for trucks, rail and air each day.
Walmart Opens First in Series of Next-Gen Fulfillment Centers
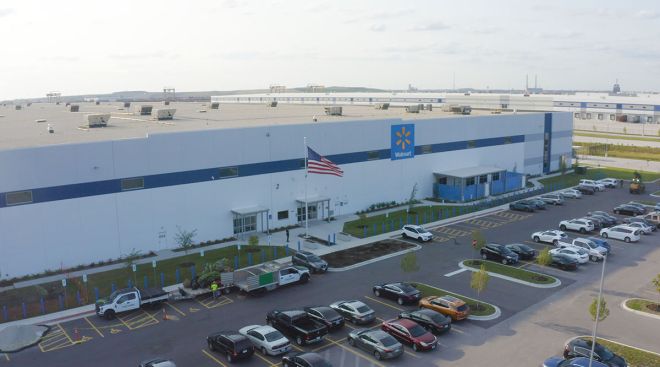
Walmart Inc. announced a 1.1 million-square-foot next-generation fulfillment center in Joliet, Ill.
September 29, 2022Clean Energy Fuels, Amazon Partner on RNG
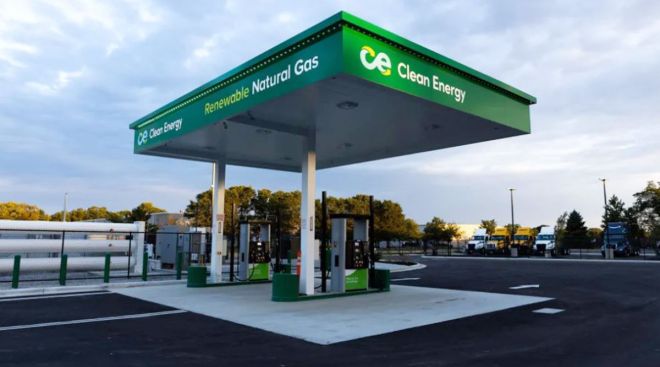
Clean Energy Fuels Corp. announced Amazon.com Inc. will fuel trucks with renewable natural gas at the company’s public access station in Groveport, Ohio, as the two begin a larger partnership.
September 28, 2022Amazon’s Robotaxi Arm Zoox Coming ‘Sooner Than People Expect’

The CEO of Zoox, Amazon .com Inc.’s self-driving unit, expects autonomous vehicles to be present in cities “sooner than people expect,” but stopped short of saying when her own company’s product would appear on roads.
Walmart to Hire 40,000 Holiday Workers, Fewer Than Last Year
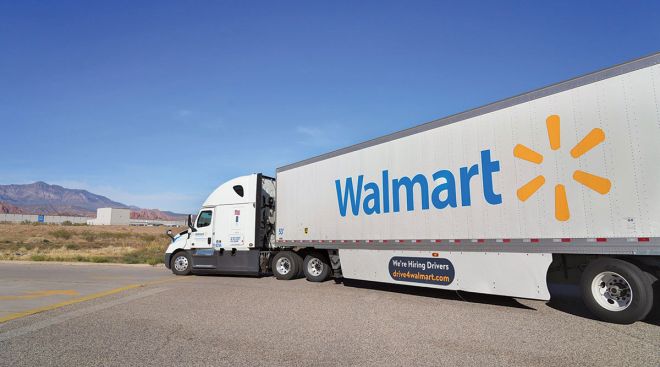
Walmart Inc., the largest private-sector employer in the U.S., aims to hire 40,000 seasonal workers for the holiday season this year — a sizable decrease from 2021.
Amazon Signs Deal to Bring Low-Carbon Fuels to Trucking Fleet
SEATTLE — Amazon .com Inc. signed an agreement with renewable fuels technology company Infinium on Sept. 20 to begin powering its transport vehicles with ultra-low carbon electrofuels starting in 2023.
-

2022
-
2021
-
2020
-
2019
-
2018
-
2017
-
2016
-
2015
-
2014
-
2013
-
2012
-
2011
-
2010
-
2009
-
2008
-
2007
-
2006
-
2005
-
2004


