


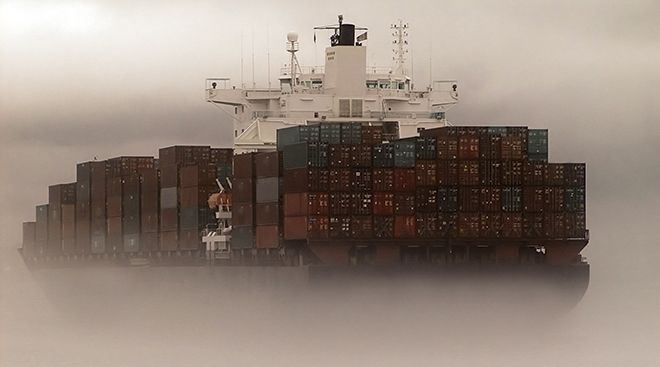
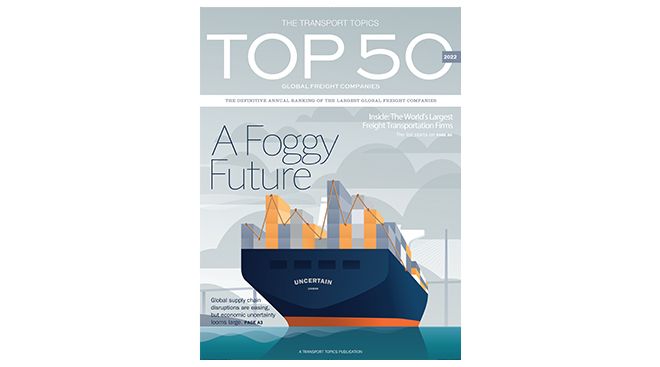
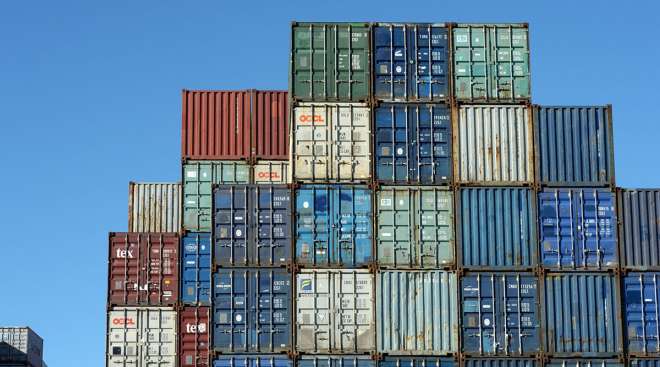
Supply chain disruptions may be easing, but freight volumes continue to stir anxiety in shippers.
Non-asset based companies join the field in this year’s Global Freight Top 50 list.
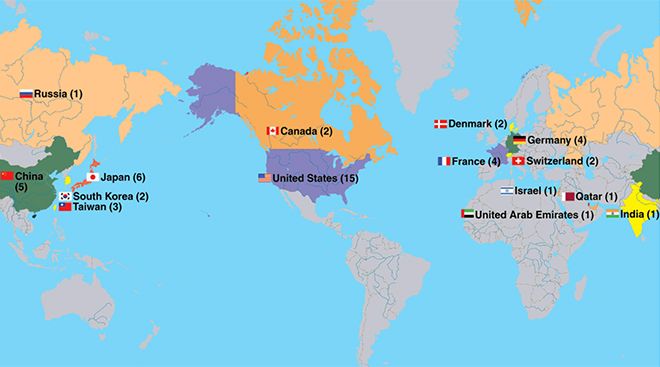
Get a continent-by-continent and country-by-country look at where the Top 50 Global Freight Companies are based.
Rankings
Port Data
| Rank | Port Name | City | Type of Freight | TEUs 2021 | TEUs 2020 | % Change | Freight Tonnage (metric tons) |
|---|---|---|---|---|---|---|---|
| 1 | Port of Los Angeles * | Los Angeles | container, break bulk, dry bulk, liquid bulk, automotive, heavy lift, special project cargo, refrigerated, passenger | 10,677,610 | 9,213,396 | 15.9% | 222,000,000 |
| 2 | Port of Long Beach | Long Beach, Calif. | container, break bulk, dry bulk, liquid bulk, automotive, heavy lift, special project cargo, refrigerated, passenger | 9,384,368 | 8,113,315 | 15.7% | 196,386,014 |
| 3 | Port of New York and New Jersey ^ | New York | container, break bulk, dry bulk, liquid bulk, automotive, heavy lift, special project cargo, refrigerated, passenger | 8,985,929 | 7,585,819 | 18.5% | 112,216,428 |
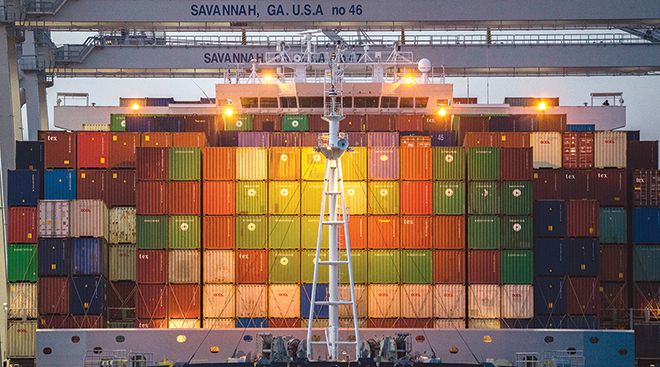
| 4 | Port of Savannah ^ | Savannah, Ga. | container, break bulk, heavy lift, automobile, refrigerated | 5,613,163 | 4,682,249 | 19.9% | 39,419,938 |
| 5 | Ports of Colon, Cristobal and Manzanillo ** | Colón, Panama | container, liquid bulk, dry bulk, passenger, transshipping | 4,915,975 | 4,454,902 | 10.3% | |
| 6 | Northwest Seaport Alliance | Seattle and Tacoma, Wash. | container, break bulk, liquid bulk, dry bulk, automobile, heavy lift, special project cargo, refrigerated, passenger, air cargo | 3,736,206 | 3,320,379 | 12.5% | 27,363,475 |
| 7 | Port of Vancouver | Vancouver, British Columbia | container, break bulk, dry bulk, liquid bulk, automobile, special project cargo, passenger | 3,678,952 | 3,467,521 | 6.1% | |
| 8 | Port of Balboa/PSA Panama International Terminal | Panama Int'l Terminals, Panama | container, transshipping | 3,561,432 | 3,161,658 | 12.6% | |
| 9 | Port of Virginia | Norfolk, Va. | container, break bulk, dry bulk, liquid bulk, automobile | 3,522,834 | 2,813,415 | 25.2% | 55,797,100 |
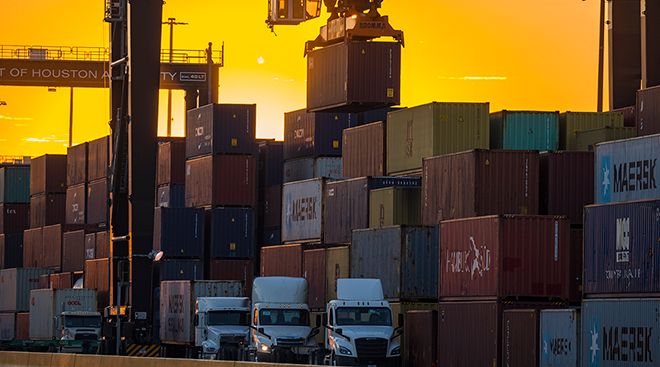
| 10 | Port Houston | Houston | container, break bulk, dry bulk, liquid bulk | 3,453,226 | 3,001,164 | 15.1% | 40,399,937 |
| 11 | Port of Manzanillo | Manzanillo, Colima, Mexico | container, dry bulk, liquid bulk | 3,371,438 | 2,909,632 | 15.9% | 35,024,782 |
| 12 | Port of Charleston ^ | Charleston, S.C. | container, break bulk, dry bulk, automobile, refrigerated | 2,751,442 | 2,309,995 | 19.1% | 22,631,975 |
| 13 | Port of Oakland ^ | Oakland, Calif. | container | 2,448,243 | 2,461,262 | -0.5% | 17,635,455 |
| 14 | Port of Kingston | Kingston, Jamaica | container, heavy lift, liquid bulk | 1,975,401 | 1,611,637 | 22.6% | |
| 15 | Port of Montreal | Montreal | container, break bulk, dry bulk, liquid bulk, passenger | 1,728,114 | 1,600,000 | 8.0% | 34,023,135 |
| 16 | Port of Lázaro Cárdenas | Lázaro Cárdenas, Michoacán, Mexico | container, break bulk, dry bulk, liquid bulk | 1,686,076 | 1,063,675 | 58.5% | |
| 17 | Port of Freeport | Freeport, Bahamas | container, passenger | 1,642,780 | 1,231,703 | 33.4% | |
| 18 | Port of San Juan ^ | San Juan, Puerto Rico | container | 1,438,738 | 1,490,218 | -3.5% | 8,470,533 |
| 19 | Port of Jacksonville *** | Jacksonville, Fla. | container, break bulk, dry bulk, liquid bulk, automobile, heavy lift, refrigerated | 1,407,310 | 1,277,161 | 10.2% | 9,378,906 |
| 20 | Moín Container Terminal | Límon, Costa Rica | container | 1,319,372 | 1,213,431 | 8.7% | |
| 21 | Port Miami *** | Miami | container, passenger | 1,254,062 | 1,066,738 | 17.6% | 10,114,409 |
| 22 | Port of Veracruz | Veracruz, Veracruz, Mexico | container, dry bulk, liquid bulk, automobile | 1,165,043 | 1,005,936 | 15.8% | |
| 23 | Port of Prince Rupert | Prince Rupert, British Columbia | container, break bulk, dry bulk, liquid bulk, special project cargo, passenger | 1,054,836 | 1,141,390 | -7.6% | 25,071,050 |
| 24 | Port Everglades *** | Broward County, Fla. | container, break bulk, dry bulk, liquid bulk, passenger | 1,038,179 | 945,512 | 9.8% | 21,346,991 |
| 25 | Port of Baltimore ^ | Baltimore | container, break bulk, dry bulk, liquid bulk, automobile, refrigerated, passenger | 1,022,683 | 1,051,840 | -2.8% | 31,934,742 |
| NOTE: Data for the ports of Manzanillo (Mexico), Kingston, Lázaro Cárdenas, Freeport, San Juan, Moín Container Terminal and Veracruz are from the United Nations Economic Commission for Latin America and the Carribbean. Data for the ports of Balboa, PSA Panama International Terminal, Cristobal, Colon Container Terminal and Manzanillo International Terminal are from the Georgia Tech Panama Logistics Innovation and Research Center. All other data is from respective port authorities. * Tonnage data for the Port of Los Angeles is from its fiscal year ending June 30, 2021. ** Includes data regarding the Panamanian ports of Cristobal, Colon Container Terminal and Manzanillo International Terminal; not to be confused with the Port of Manzanillo in Colima, Mexico. *** TEU and tonnage data for the Port of Jacksonville, Port Miami and Port Everglades is from their fiscal year ending Sept. 30, 2021. ^ Tonnage data for the ports of New York and New Jersey, Savannah, Charleston, Oakland, San Juan and Baltimore are from calendar year 2020, sourced from the United States Army Corp of Engineers. All other tonnage data is from calendar year 2021. |
|||||||

Last year saw air- and sea-freight volumes bounce back from supply chain struggles.
If your company appears in the 2022 list, you have a few ways to announce it. Visit our logo library to get web- and print-ready graphics.
Learn more about Transport Topics’ Top 50 Global Freight Companies publication.
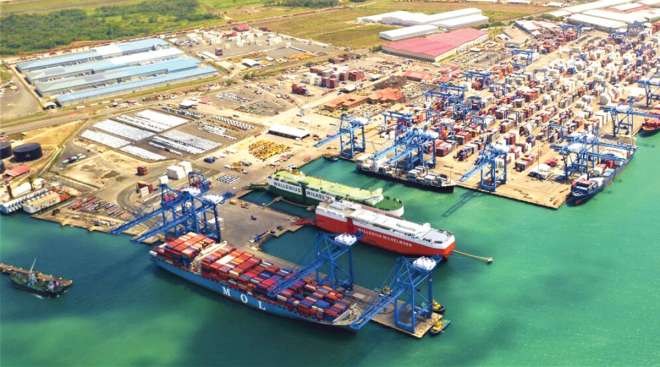
Greek Shipping Giant Warns Panama Canal Chaos May Hit Suez
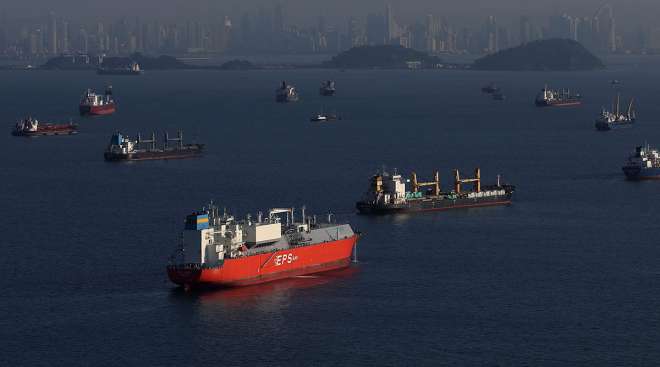
Congestion at the Panama Canal could result in delays at Egypt’s Suez Canal, possibly affecting cargoes of liquefied natural gas, according to an official at Angelicoussis Group.
November 29, 2023DP World Says Some Personal Employee Data Stolen in Hack
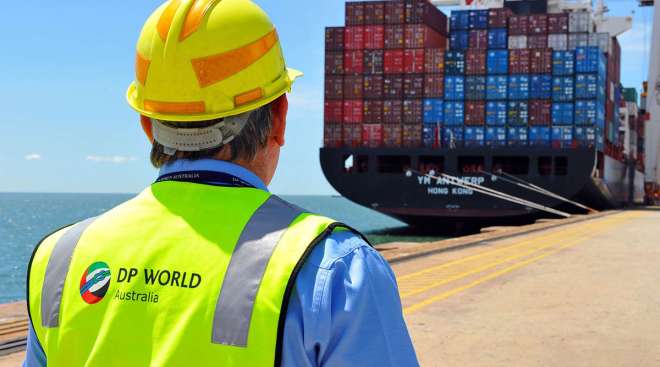
DP World Plc said workers’ personal information was stolen in the November cyberattack on the port operator’s Australian business.
November 28, 2023Shippers to Europe Facing $3.6 Billion Carbon Bill in 2024
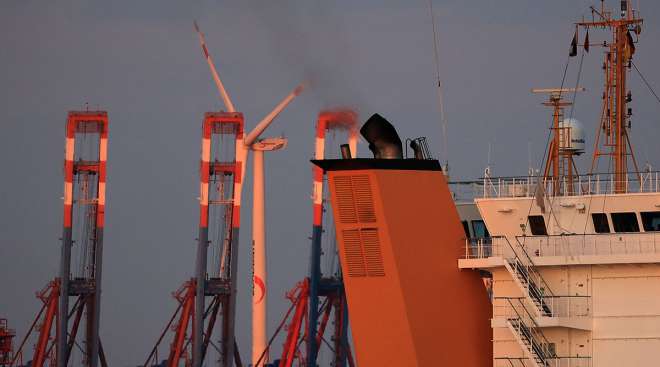
Ships sailing to European ports face a combined carbon emissions bill of $3.6 billion next year, the start of a levy that’s likely to rise as Europe steps up efforts to combat climate change.
November 21, 2023Major Shippers Don’t Predict Issues Meeting Holiday Demand
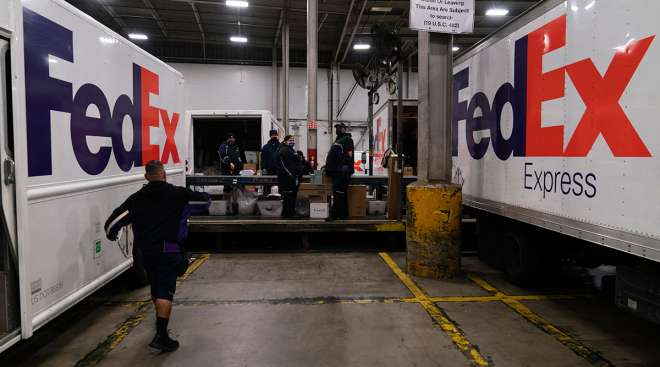
Carriers like the U.S. Postal Service, FedEx and UPS Inc. have capacity to meet projected demand this holiday season, which is cheery news for shippers and shoppers alike.
November 21, 2023Container Shipping Seeing Major Cuts After $364 Billion Boom
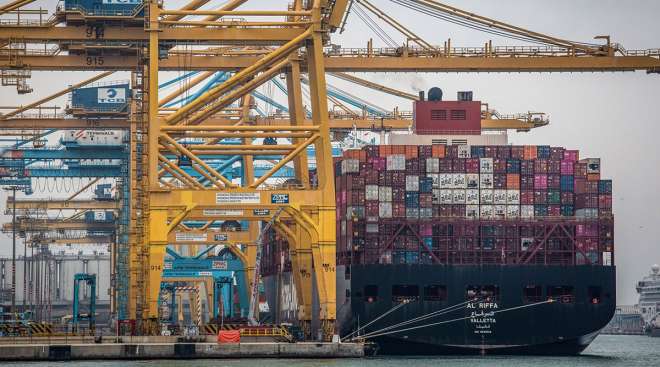
The container shipping industry, after two years of record-high freight rates and slow deliveries, is seeing its boom become a bust due to oversupply following the COVID-19 demand highs.
November 14, 2023Australia Cyberattack Leaves 30,000 Containers Stuck at Ports
DP World Plc is struggling to work through a backlog of 30,000 shipping containers piled up at ports across Australia as the company resumes operations after a cyberattack.
November 13, 2023Container Shipping Set for Downturn, Hapag-Lloyd Chief Says
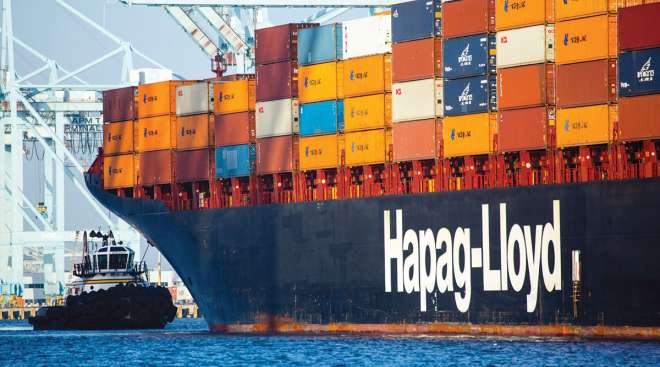
The container shipping industry faces a few years of headwinds as low freight rates and widening geopolitical turmoil cloud the outlook, according to Hapag-Lloyd AG CEO Rolf Habben Jansen.
November 9, 2023Port of Long Beach Gets DOT Grant for Rail Facility Project
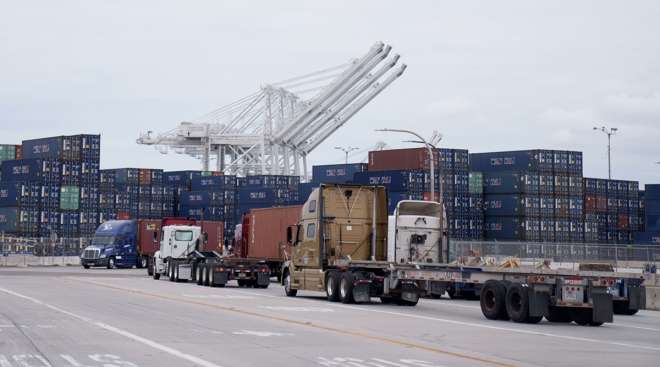
The Port of Long Beach will improve and expand several roadways within its Pier B railyard, officials announced on Nov. 3, with a $52.6 million grant from the Department of Transportation.
November 6, 2023Air and Ocean Freight Deal With Fluctuating Volumes in 2022
2022 saw an eastern shift in container shipping within the United States, while airfreight volumes dipped across North America.
November 3, 2023Port Authorities Look to Make the Right Adjustments
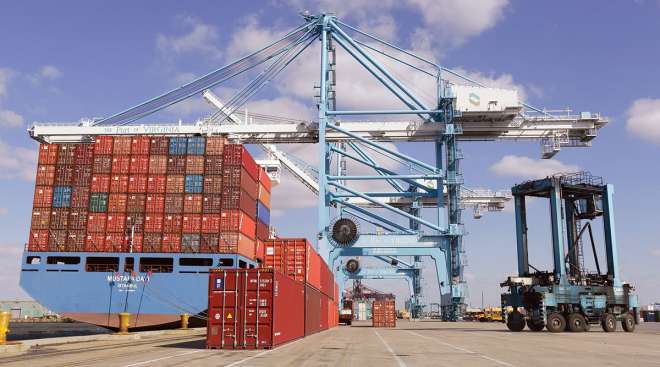
In efforts to improve the supply chain system, U.S. port operators are utilizing advancements in infrastructure and technology to accommodate bigger ships and manage more cargo.
November 3, 2023-

2022
-
2021
-
2020
-
2019
-
2018
-
2017
-
2016
-
2015


