


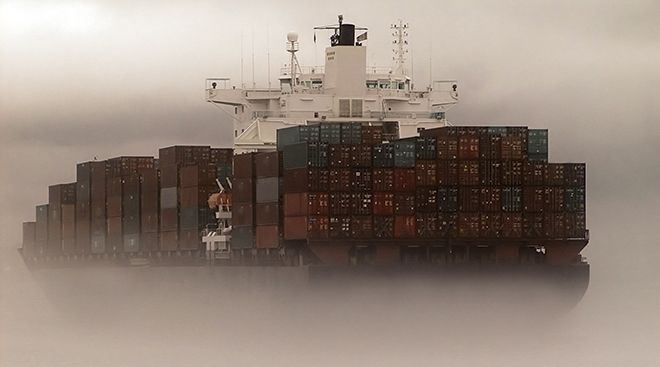
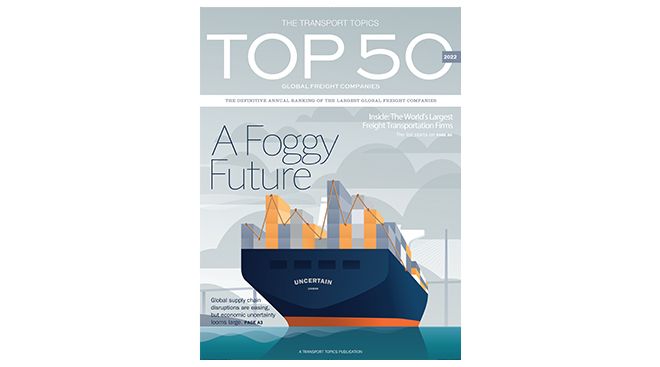
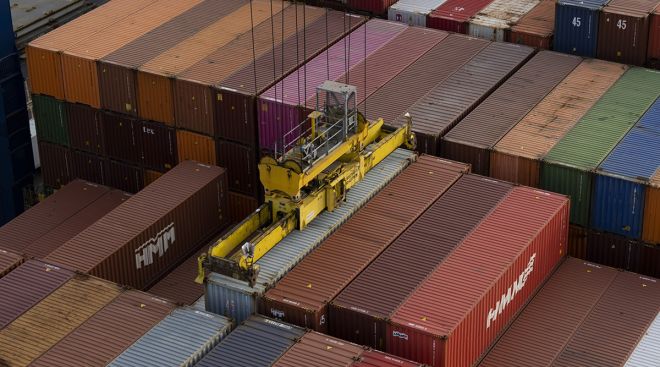
Supply chain disruptions may be easing, but freight volumes continue to stir anxiety in shippers.
Non-asset based companies join the field in this year’s Global Freight Top 50 list.
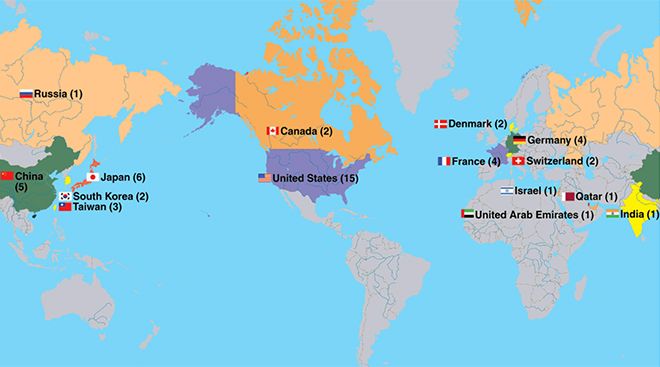
Get a continent-by-continent and country-by-country look at where the Top 50 Global Freight Companies are based.
Rankings
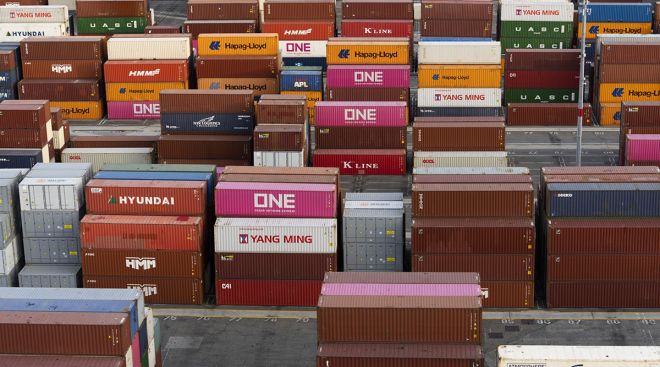
Port Data
| Rank | Port Name | City | Type of Freight | TEUs 2021 | TEUs 2020 | % Change | Freight Tonnage (metric tons) |
|---|---|---|---|---|---|---|---|
| 1 | Port of Los Angeles * | Los Angeles | container, break bulk, dry bulk, liquid bulk, automotive, heavy lift, special project cargo, refrigerated, passenger | 10,677,610 | 9,213,396 | 15.9% | 222,000,000 |
| 2 | Port of Long Beach | Long Beach, Calif. | container, break bulk, dry bulk, liquid bulk, automotive, heavy lift, special project cargo, refrigerated, passenger | 9,384,368 | 8,113,315 | 15.7% | 196,386,014 |
| 3 | Port of New York and New Jersey ^ | New York | container, break bulk, dry bulk, liquid bulk, automotive, heavy lift, special project cargo, refrigerated, passenger | 8,985,929 | 7,585,819 | 18.5% | 112,216,428 |
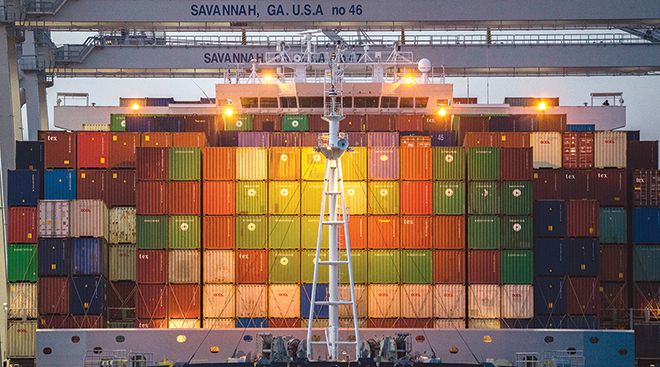
| 4 | Port of Savannah ^ | Savannah, Ga. | container, break bulk, heavy lift, automobile, refrigerated | 5,613,163 | 4,682,249 | 19.9% | 39,419,938 |
| 5 | Ports of Colon, Cristobal and Manzanillo ** | Colón, Panama | container, liquid bulk, dry bulk, passenger, transshipping | 4,915,975 | 4,454,902 | 10.3% | |
| 6 | Northwest Seaport Alliance | Seattle and Tacoma, Wash. | container, break bulk, liquid bulk, dry bulk, automobile, heavy lift, special project cargo, refrigerated, passenger, air cargo | 3,736,206 | 3,320,379 | 12.5% | 27,363,475 |
| 7 | Port of Vancouver | Vancouver, British Columbia | container, break bulk, dry bulk, liquid bulk, automobile, special project cargo, passenger | 3,678,952 | 3,467,521 | 6.1% | |
| 8 | Port of Balboa/PSA Panama International Terminal | Panama Int'l Terminals, Panama | container, transshipping | 3,561,432 | 3,161,658 | 12.6% | |
| 9 | Port of Virginia | Norfolk, Va. | container, break bulk, dry bulk, liquid bulk, automobile | 3,522,834 | 2,813,415 | 25.2% | 55,797,100 |
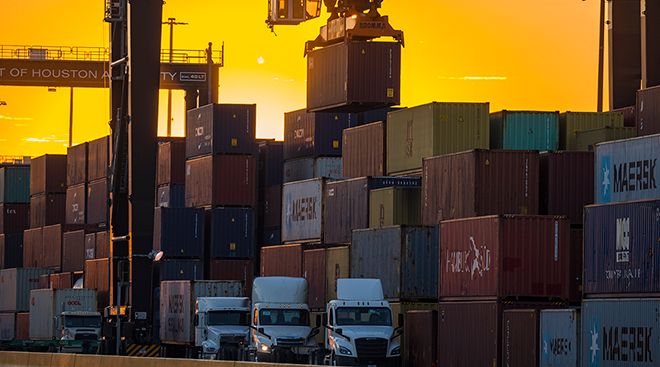
| 10 | Port Houston | Houston | container, break bulk, dry bulk, liquid bulk | 3,453,226 | 3,001,164 | 15.1% | 40,399,937 |
| 11 | Port of Manzanillo | Manzanillo, Colima, Mexico | container, dry bulk, liquid bulk | 3,371,438 | 2,909,632 | 15.9% | 35,024,782 |
| 12 | Port of Charleston ^ | Charleston, S.C. | container, break bulk, dry bulk, automobile, refrigerated | 2,751,442 | 2,309,995 | 19.1% | 22,631,975 |
| 13 | Port of Oakland ^ | Oakland, Calif. | container | 2,448,243 | 2,461,262 | -0.5% | 17,635,455 |
| 14 | Port of Kingston | Kingston, Jamaica | container, heavy lift, liquid bulk | 1,975,401 | 1,611,637 | 22.6% | |
| 15 | Port of Montreal | Montreal | container, break bulk, dry bulk, liquid bulk, passenger | 1,728,114 | 1,600,000 | 8.0% | 34,023,135 |
| 16 | Port of Lázaro Cárdenas | Lázaro Cárdenas, Michoacán, Mexico | container, break bulk, dry bulk, liquid bulk | 1,686,076 | 1,063,675 | 58.5% | |
| 17 | Port of Freeport | Freeport, Bahamas | container, passenger | 1,642,780 | 1,231,703 | 33.4% | |
| 18 | Port of San Juan ^ | San Juan, Puerto Rico | container | 1,438,738 | 1,490,218 | -3.5% | 8,470,533 |
| 19 | Port of Jacksonville *** | Jacksonville, Fla. | container, break bulk, dry bulk, liquid bulk, automobile, heavy lift, refrigerated | 1,407,310 | 1,277,161 | 10.2% | 9,378,906 |
| 20 | Moín Container Terminal | Límon, Costa Rica | container | 1,319,372 | 1,213,431 | 8.7% | |
| 21 | Port Miami *** | Miami | container, passenger | 1,254,062 | 1,066,738 | 17.6% | 10,114,409 |
| 22 | Port of Veracruz | Veracruz, Veracruz, Mexico | container, dry bulk, liquid bulk, automobile | 1,165,043 | 1,005,936 | 15.8% | |
| 23 | Port of Prince Rupert | Prince Rupert, British Columbia | container, break bulk, dry bulk, liquid bulk, special project cargo, passenger | 1,054,836 | 1,141,390 | -7.6% | 25,071,050 |
| 24 | Port Everglades *** | Broward County, Fla. | container, break bulk, dry bulk, liquid bulk, passenger | 1,038,179 | 945,512 | 9.8% | 21,346,991 |
| 25 | Port of Baltimore ^ | Baltimore | container, break bulk, dry bulk, liquid bulk, automobile, refrigerated, passenger | 1,022,683 | 1,051,840 | -2.8% | 31,934,742 |
| NOTE: Data for the ports of Manzanillo (Mexico), Kingston, Lázaro Cárdenas, Freeport, San Juan, Moín Container Terminal and Veracruz are from the United Nations Economic Commission for Latin America and the Carribbean. Data for the ports of Balboa, PSA Panama International Terminal, Cristobal, Colon Container Terminal and Manzanillo International Terminal are from the Georgia Tech Panama Logistics Innovation and Research Center. All other data is from respective port authorities. * Tonnage data for the Port of Los Angeles is from its fiscal year ending June 30, 2021. ** Includes data regarding the Panamanian ports of Cristobal, Colon Container Terminal and Manzanillo International Terminal; not to be confused with the Port of Manzanillo in Colima, Mexico. *** TEU and tonnage data for the Port of Jacksonville, Port Miami and Port Everglades is from their fiscal year ending Sept. 30, 2021. ^ Tonnage data for the ports of New York and New Jersey, Savannah, Charleston, Oakland, San Juan and Baltimore are from calendar year 2020, sourced from the United States Army Corp of Engineers. All other tonnage data is from calendar year 2021. |
|||||||

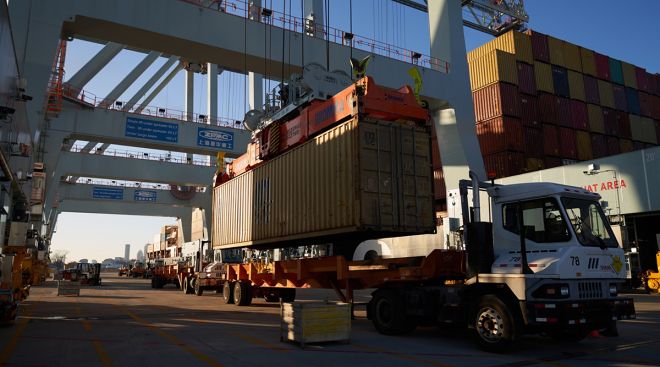
Last year saw air- and sea-freight volumes bounce back from supply chain struggles.
If your company appears in the 2022 list, you have a few ways to announce it. Visit our logo library to get web- and print-ready graphics.
Learn more about Transport Topics’ Top 50 Global Freight Companies publication.
Supply Chain Envoy Says Automating Ports Doesn’t Have to Cost Jobs
The White House’s supply chain envoy said the ports and logistics industry must move toward automation, a sticking point in protracted contract talks between U.S. West Coast dockworkers and their employers.
March 1, 2023USPS Buys Electric Vans, Charging Stations in Bulk
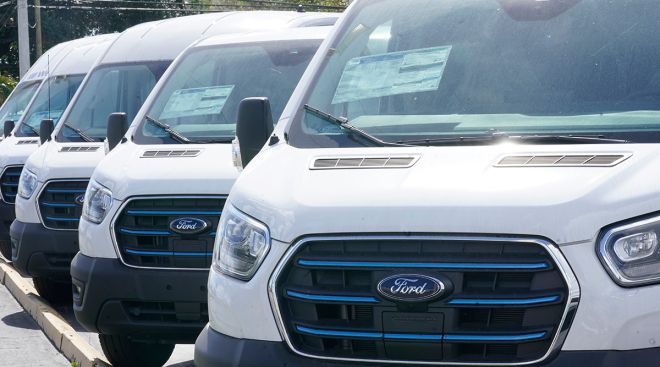
WASHINGTON — The U.S. Postal Service is buying 9,250 Ford Motor Co. electric vans and 14,000 charging stations as part of a move to switch its fleet to electric vehicles.
March 1, 2023Supply Chains Have Healed, Yet Their Mark on Inflation to Endure
Supply chains across the world are healing up almost as fast as they broke down. That doesn’t mean the pressure they’re exerting on inflation will disappear as quickly.
February 27, 2023FedEx Pilots Plan Strike Authorization Vote as Labor Talks Stall
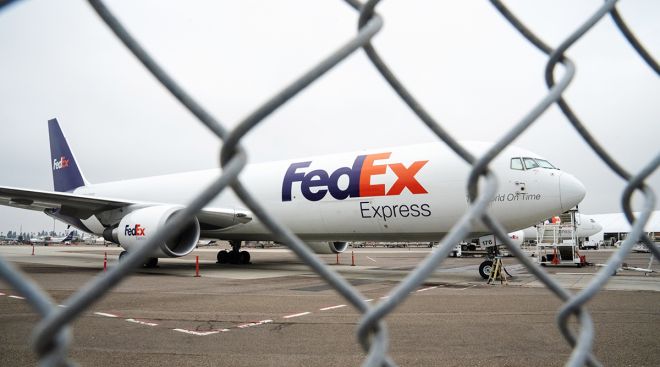
FedEx Corp. pilots are inching closer to a potential strike as negotiations stall on a new labor agreement.
February 23, 2023Maersk Suing Evergreen Over 2021 Suez Canal Blockage
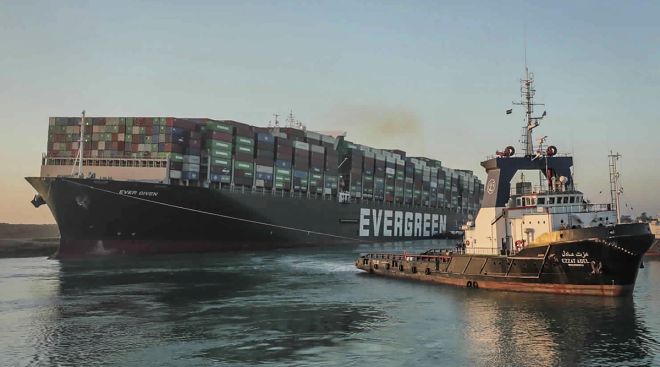
Shipping giant A.P. Moeller-Maersk said in an email to The Associated Press that it filed a claim against Evergreen Marine Corp., the vessel’s Japanese owner and its German technical manager in the Danish Maritime and Commercial High Court.
February 13, 2023Maersk Sees Global Trade Contracting as Much as 2.5% in 2023
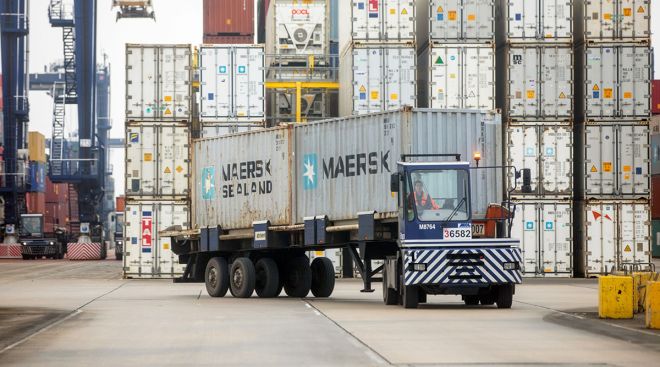
A.P. Moller-Maersk A/S said “muted” economic growth is set to push the world’s container shipping volumes down by as much as 2.5% this year.
February 8, 2023Thousands of CSX Workers First to Get Paid Sick Leave
OMAHA, Neb. — Several thousand workers at CSX will soon get one of the things that pushed the U.S. railroad industry to the brink of a strike last fall: paid sick time.
February 8, 2023Supply Chains Must Change, Says Maersk’s Ditlev Blicher

Increasing volatility in global supply chains means shipping lines must undergo a radical restructuring to survive, according to A.P. Moller-Maersk A/S.
February 8, 2023FedEx to Cut Management Jobs by More Than 10%
FedEx Corp. is cutting global officer and director jobs by more than 10%, the courier’s latest cost-saving measure as economic concerns and waning e-commerce weigh on demand for package delivery.
February 1, 2023Drop in Global Shipping Costs Signals Cooling Inflation, Experts Say
The pandemic-era surge in shipping costs was a “smoking gun” that foretold the global inflation spike, and the sharp drop in maritime-freight expenses since peaking last year will contribute to an easing in price pressures.
January 25, 2023-

2022
-
2021
-
2020
-
2019
-
2018
-
2017
-
2016
-
2015


