


| Rank This Year | Rank Last Year | Company | Revenue (000) | Net Income (000) | Employees | Tractors* | Trailers |
|---|---|---|---|---|---|---|---|
| 100 | 97 | United Vision Logistics
|
275,000 | - | 977 | 1,217 | |
| 99 | 98 | Superior Bulk Logistics
|
277,000 | - | 1,100 | 2,000 | |
| 98 | PGT Trucking
|
280,000 | - | 675 | 1,020 | 1,820 | |
| 97 | 94 | Martin Transportation Systems
|
282,483 | - | 2,179 | 1,261 | 2,592 |
| 95 | 95 | Quantix Supply Chain Solutions
|
285,000 | - | 1,100 | 858 | 1,132 |
| 95 | 96 | Challenger Motor Freight
|
285,000 | - | 1,875 | 1,530 | 3,350 |
| 94 | 100 | Acme Truck Line
|
290,475 | - | 2,000 | 900 | 1,000 |
| 93 | Hansen & Adkins Auto Transport
|
290,935 | - | 1,137 | 1,139 | ||
| 92 | 90 | Dependable Supply Chain Services
|
291,000 | - | 346 | 1,113 | |
| 91 | 85 | Cassens Transport Co.
|
292,635 | - | 1,126 | 1,150 | 1,150 |
| 90 | Heniff Transportation Systems
|
293,000 | - | 1,100 | 3,000 | ||
| 89 | 99 | John Christner Trucking
|
295,171 | 24,907 | 207 | 801 | 1,103 |
| 86 | 91 | Trans-System Inc.
|
300,000 | - | 1,100 | 1,000 | 1,870 |
| 86 | ContainerPort Group
|
300,000 | - | 400 | 1,400 | 100 | |
| 86 | RoadOne IntermodaLogistics
|
300,000 | - | 1,700 | 200 | ||
| 85 | 92 | Melton Truck Lines
|
302,227 | - | 1,701 | 1,359 | 2,276 |
| 84 | 86 | TransAm Trucking
|
307,000 | - | 1,135 | 1,823 | |
| 83 | 89 | Koch Cos.
|
310,000 | - | 1,167 | 1,155 | 5,432 |
| 82 | 88 | Foodliner/Quest Liner
|
317,062 | - | 1,301 | 1,279 | 2,301 |
| 81 | Red Classic
|
354,416 | - | 1,211 | 546 | 2,647 | |
| 80 | 82 | IMC Cos.
|
368,560 | - | 2,001 | 1,455 | 148 |
| 79 | 72 | Mesilla Valley Transportation
|
383,950 | - | 1,662 | 1,400 | 5,000 |
| 78 | 81 | Transport Investments
|
384,719 | - | 200 | 1,035 | 1,899 |
| 77 | 80 | Maverick USA
|
395,771 | - | 2,156 | 1,632 | 2,446 |
| 76 | 78 | Roehl Transport
|
421,330 | - | 2,460 | 1,966 | 4,902 |
| 75 | 79 | A. Duie Pyle Inc.
|
428,800 | - | 2,851 | 1,083 | 2,086 |
| 74 | 77 | LaserShip Inc./OnTrac Inc.
|
435,000 | - | 14 | 10 | |
| 73 | 87 | Hirschbach Motor Lines
|
454,454 | - | 1,213 | 1,860 | 3,490 |
| 72 | 74 | TMC Transportation
|
464,000 | - | 2,752 | 3,691 | |
| 71 | 67 | 10 Roads Express
|
480,806 | - | 1,857 | 2,281 | |
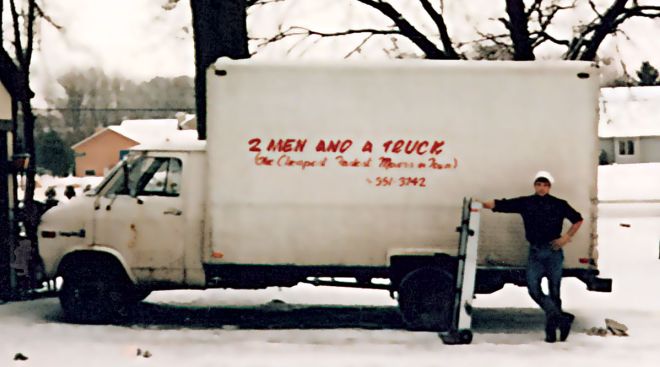
| 70 | 64 | Two Men and a Truck Movers
|
487,236 | - | 6,334 | ||
| 69 | 75 | Black Horse Carriers
|
491,000 | - | 3,438 | 1,700 | 4,000 |
| 68 | 68 | Dart Transit Co.
|
491,912 | - | 2,362 | 2,068 | 7,408 |
| 67 | 61 | Canada Cartage System
|
501,659 | - | 3,160 | 3,309 | 2,817 |
| 66 | 56 | Trimac Transportation
|
528,672 | - | 3,165 | 1,966 | 4,080 |
| 65 | 71 | P.A.M. Transport
|
533,261 | 23,994 | 2,748 | 2,031 | 6,397 |
| 64 | 69 | USA Truck (DB Schenker)
|
534,060 | 12,204 | 2,400 | 1,674 | 5,531 |
| 63 | 66 | Cowan Systems
|
537,163 | - | 2,107 | 2,073 | 5,785 |
| 62 | 65 | Bison Transport
|
556,684 | - | 3,100 | 1,697 | 5,096 |
| 61 | 57 | OnTrac Inc.
|
562,856 | - | 23 | 900 | |
| 60 | 54 | Jack Cooper Holdings
|
581,000 | - | 3,753 | 1,843 | 2,290 |
| 59 | 60 | Suddath
|
600,000 | - | 2,200 | ||
| 58 | 63 | Mercer Transportation Co.
|
602,504 | - | 305 | 2,608 | 2,608 |
| 57 | 53 | Heartland Express
|
610,803 | 72,677 | 3,450 | 2,906 | 10,506 |
| 56 | 62 | Bennett International Group
|
612,140 | - | 1,124 | 1,632 | 2,698 |
| 54 | 51 | United Road Services
|
659,000 | - | 1,846 | 2,550 | 1,300 |
| 54 | 59 | Dayton Freight Lines
|
659,000 | 89,577 | 4,922 | 1,752 | 4,408 |
| 53 | 52 | Mullen Group
|
674,027 | - | 3,759 | 1,978 | 5,055 |
| 52 | 58 | Western Express
|
695,122 | - | 3,250 | 2,805 | 7,600 |
| 51 | 49 | Stevens Transport
|
719,870 | 102,660 | 2,700 | 2,715 | 3,900 |
| 50 | 50 | AAA Cooper Transportation
|
725,000 | - | 5,234 | 2,690 | 6,800 |
| 49 | 55 | PS Logistics
|
747,339 | - | 3,664 | 3,150 | 5,300 |
| 48 | 48 | Marten Transport
|
787,594 | 55,027 | 3,600 | 2,661 | 5,594 |
| 47 | 44 | Cardinal Logistics
|
800,000 | - | 4,220 | 2,560 | 8,000 |
| 46 | 45 | Day & Ross
|
806,806 | - | 3,277 | 2,872 | 9,006 |
| 45 | 42 | Quality Carriers
|
822,000 | - | 2,541 | 5,204 | |
| 44 | 43 | Central Transport International
|
825,000 | - | 3,180 | 6,543 | |
| 43 | 46 | Pitt Ohio Transportation Group
|
826,947 | - | 5,751 | 2,047 | 5,534 |
| 42 | 47 | Covenant Logistics Group
|
885,455 | 42,503 | 5,500 | 3,154 | 6,950 |
| 41 | 40 | Atlas World Group
|
900,500 | 10,000 | 650 | 1,064 | 4,136 |
| 40 | 37 | KLLM Transport Services
|
917,000 | - | 3,500 | 5,400 | |
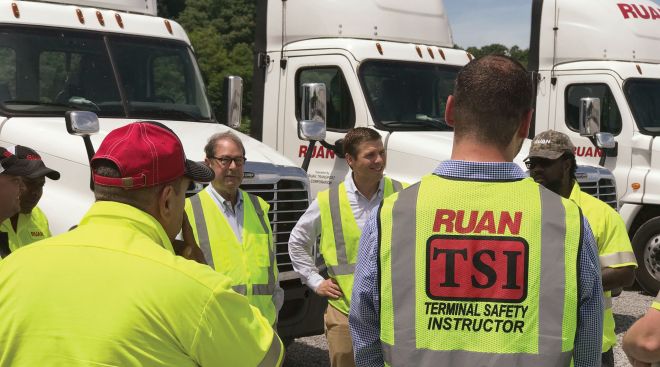
| 39 | 41 | Ruan
|
957,131 | - | 5,700 | 3,700 | 9,600 |
| 38 | 35 | Celadon Group Inc.
|
999,700 | - | 5,500 | 3,850 | 10,000 |
| 37 | 38 | Lynden
|
1,050,000 | - | 2,658 | 998 | 2,679 |
| 36 | 28 | Purolator
|
1,078,043 | - | 10,000 | 465 | 1,329 |
| 35 | 34 | Crete Carrier Corp.
|
1,156,000 | - | 6,000 | 5,373 | 13,430 |
| 34 | 39 | Evans Delivery
|
1,163,625 | - | 429 | 6,000 | 550 |
| 33 | 36 | Anderson Trucking Service
|
1,244,459 | - | 2,143 | 2,636 | 6,978 |
| 32 | 32 | Averitt Express
|
1,298,463 | - | 9,000 | 4,947 | 15,182 |
| 31 | 32 | Forward Air
|
1,320,886 | 92,051 | 5,411 | 1,185 | 6,647 |
| 30 | 30 | Southeastern Freight Lines
|
1,378,929 | - | 8,989 | 3,570 | 11,569 |
| 29 | 26 | Sirva Inc.
|
1,400,000 | - | 1,657 | 2,867 | |
| 28 | 31 | Universal Logistics Holdings
|
1,461,708 | 52,178 | 6,335 | 4,057 | 6,152 |
| 27 | 24 | Kenan Advantage Group
|
1,536,191 | - | 9,000 | 6,409 | 10,732 |
| 26 | 25 | C.R. England
|
1,636,138 | - | 8,196 | 4,287 | 6,494 |
| 25 | 27 | Saia Inc.
|
1,653,849 | 104,981 | 10,300 | 4,834 | 15,483 |
| 24 | 23 | CRST The Transportation Solution
|
1,685,000 | - | 7,131 | 6,052 | 14,077 |
| 23 | 22 | R+L Carriers
|
1,692,000 | - | 5,084 | 15,675 | |
| 22 | 19 | UniGroup
|
1,700,000 | - | 5,022 | 5,607 | |
| 21 | 29 | Daseke Inc.
|
1,770,000 | -5,187 | 5,930 | 6,144 | 13,824 |
| 20 | 21 | U.S. Xpress Enterprises
|
1,842,817 | 26,106 | 8,912 | 6,909 | 16,000 |
| 19 | 17 | NFI
|
2,040,000 | - | 10,900 | 4,000 | 9,700 |
| 18 | 18 | Prime Inc.
|
2,186,057 | 306,419 | 4,900 | 7,226 | 13,524 |
| 17 | 16 | Roadrunner Freight
|
2,216,141 | -165,597 | 4,600 | 3,422 | 5,563 |
| 16 | 19 | Penske Logistics
|
2,300,000 | - | 19,012 | 3,491 | 10,162 |
| 15 | 15 | Werner Enterprises
|
2,457,914 | 168,148 | 12,852 | 7,860 | 25,255 |
| 14 | 13 | ArcBest
|
3,093,788 | 67,262 | 13,000 | 4,273 | 22,680 |
| 13 | 14 | Estes Express Lines
|
3,160,000 | - | 18,451 | 7,569 | 29,519 |
| 12 | 8 | Hub Group
|
3,683,593 | 201,740 | 5,400 | 3,800 | 5,000 |
| 11 | 12 | Ryder Supply Chain Solutions
|
3,731,457 | 194,806 | |||
| 10 | 9 | TFI International
|
3,954,008 | 225,356 | 17,127 | 15,992 | 26,487 |
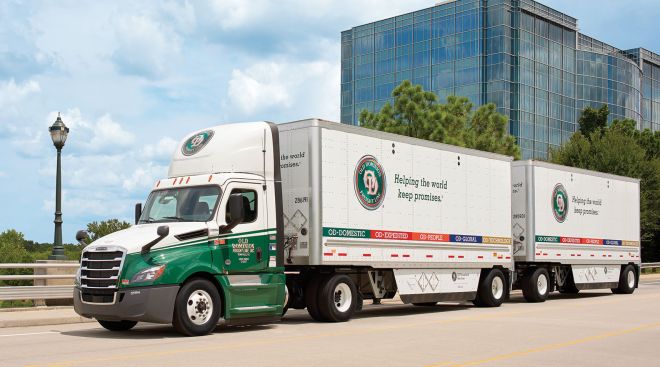
| 9 | 11 | Old Dominion Freight Line
|
4,043,695 | 605,668 | 22,858 | 9,254 | 35,729 |
| 8 | 10 | Landstar System
|
4,615,144 | 255,281 | 1,306 | 10,599 | 16,743 |
| 7 | 7 | Schneider
|
4,977,000 | 268,900 | 19,400 | 13,700 | 37,800 |
| 6 | 6 | Yellow Corp.
|
5,092,000 | 20,200 | 31,000 | 14,100 | 45,000 |
| 5 | 5 | Knight-Swift Transportation Holdings
|
5,344,066 | 456,070 | 22,800 | 19,156 | 69,544 |
| 4 | 4 | J.B. Hunt Transport Services
|
8,614,874 | 489,585 | 28,300 | 15,808 | 33,510 |
| 3 | 3 | XPO
|
17,279,000 | 390,000 | 100,000 | 14,438 | 25,689 |
| 2 | 2 | FedEx Corp.
|
69,200,000 | 3,636,000 | 425,000 | 29,813 | 113,218 |
| 1 | 1 | UPS Inc.
|
71,861,000 | 4,791,000 | 481,000 | 19,732 | 106,481 |
Top For-Hire Carriers on this list are common and contract freight carriers operating in the United States, Canada and Mexico. Companies are ranked on the basis of annual revenue. To be included in the Top 100 or any of the sectors, please send contact information to tteditor@ttnews.com. We will contact you via phone or e-mail to get information about your company prior to publication of the next Top 100 list.
* Tractor count includes company-owned, lease-to-own and owner-operator tractors.
On the Bubble


Trailer Manufacturers, Suppliers Aim to Help Fleets Curb Fuel Costs
Fleets and shippers have found that monitoring trailer performance plays an important role in achieving optimal fuel savings.
IndiGo Founder Partners With UPS for Logistics Venture
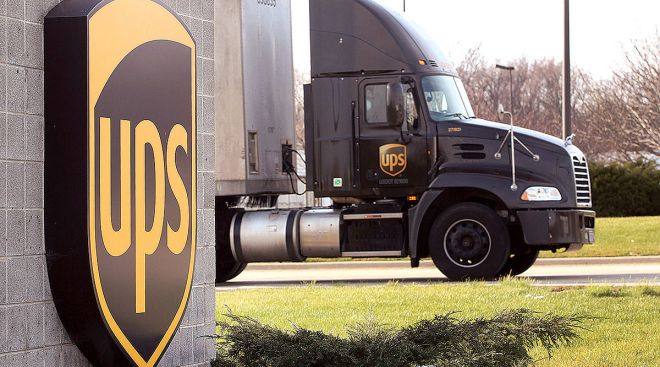
The biggest shareholder of India’s largest airline, IndiGo, teamed up with UPS Inc. to tap the South Asian nation’s growing logistics market.
Fleets Find Challenges in Rising Maintenance Costs, Parts Shortages
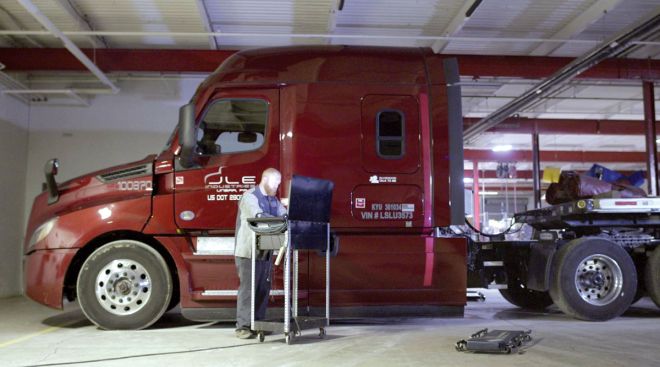
With a laundry list of hurdles facing many trucking companies, the focus on preventive maintenance becomes clearer as fleets are adding alternative suppliers and providers, and stockpiling inventory to help control costs and reduce downtime.
U.S. Xpress Cuts 70 Corporate, IT Jobs
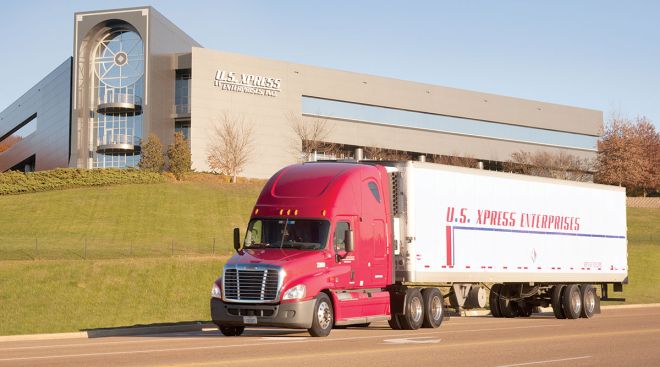
After reporting a first-quarter loss of more than $8.9 million May 5, U.S. Xpress Enterprises confirmed May 12 it laid off about 70 of its corporate and information technology staff in response to less-than-anticipated growth in the company’s trucking business.
Trucking Continues to See Robust M&A Market
Trucking and logistics continue to see strong merger and acquisition activity, a trend that goes back more than a year.
Yellow Narrows Losses, Outlines Goals
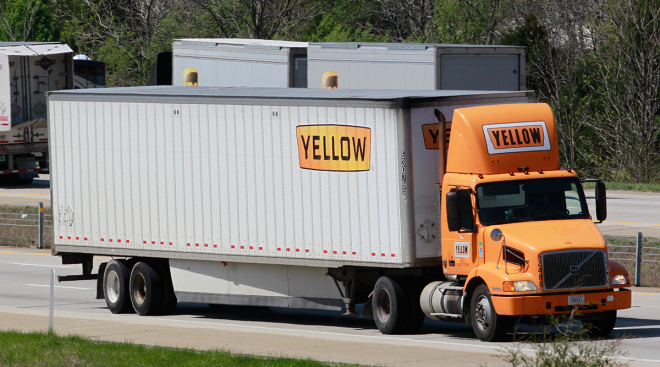
Yellow Corp. posted its best first-quarter results in six years as losses narrowed and revenue increased, the company announced May 10.
VTNA Gets Orders for 90 More VNR Electric Trucks
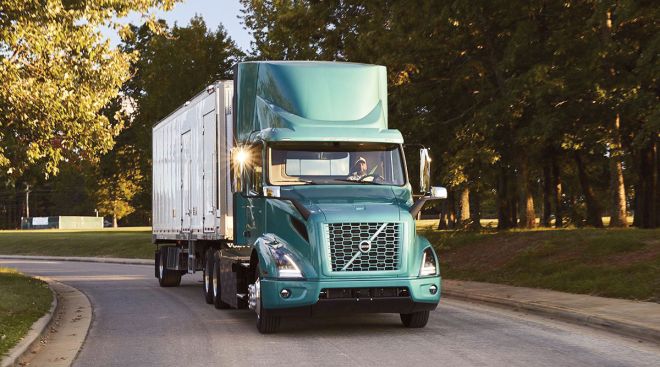
LONG BEACH, Calif. — Volvo Trucks North America announced NFI Industries and Quality Custom Distribution, between them, placed orders for an additional 90 Volvo VNR Electric Class 8 vehicles.
U.S. Xpress Reports Earnings Loss Despite Revenue Gains
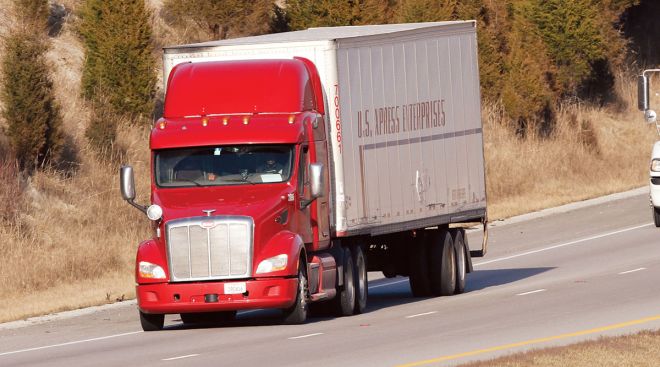
U.S. Xpress Enterprises reported revenue growth but a decline in earnings for the first quarter of 2022.
China’s Port Lockdowns Threaten Domestic Trucking
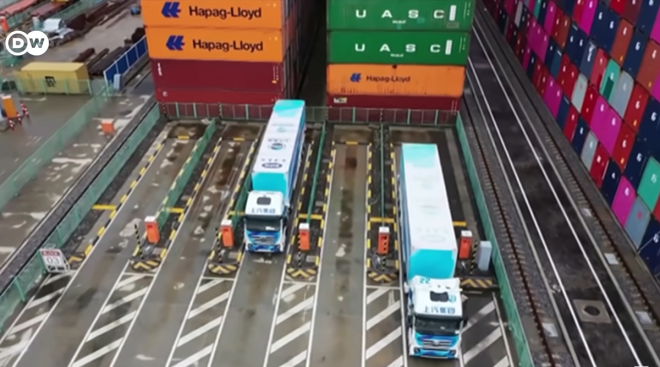
China locking down key port cities because of a new outbreak of the coronavirus could have serious ramifications for trucking in the United States.
Werner Reports 24% Increase in Revenue for Q1
Werner Enterprises posted net income of $53.7 million, or 82 cents a diluted share, for the first quarter, compared with $46.5 million, 68 cents, during the same time the previous year, the company reported May 3.
-

2022
-
2021
-
2020
-
2019
-
2018
-
2017
-
2016
-
2015
-
2014
-
2013
-
2012
-
2011
-
2010
-
2009
-
2008
-
2007
-
2006
-
2005
-
2004


