


| Rank This Year | Rank Last Year | Company | Revenue (000) | Net Income (000) | Employees | Tractors* | Trailers |
|---|---|---|---|---|---|---|---|
| 100 | Acme Truck Line
|
239,000 | - | 1,900 | 1,315 | 1,314 | |
| 99 | 96 | John Christner Trucking
|
244,696 | 13,138 | 222 | 809 | 1,112 |
| 98 | 99 | Superior Bulk Logistics
|
252,300 | 14,500 | 1,370 | 1,100 | 2,000 |
| 97 | 93 | United Vision Logistics
|
256,000 | - | 1,003 | 1,347 | |
| 96 | 89 | Challenger Motor Freight
|
258,734 | - | 1,850 | 1,469 | 3,300 |
| 95 | 100 | Quantix Supply Chain Solutions
|
259,370 | - | 1,100 | 858 | 1,132 |
| 94 | 97 | Martin Transportation Systems
|
261,403 | - | 1,725 | 1,060 | 2,250 |
| 93 | 77 | Central Freight Lines
|
266,000 | - | 2,001 | 8,012 | |
| 92 | Melton Truck Lines
|
269,785 | - | 1,569 | 1,310 | 2,111 | |
| 91 | 90 | Trans-System Inc.
|
271,000 | - | 1,050 | 1,000 | 1,700 |
| 90 | 86 | Dependable Supply Chain Services
|
274,000 | - | 344 | 1,220 | |
| 89 | 85 | Koch Cos.
|
277,000 | - | 1,190 | 1,053 | 5,476 |
| 88 | 91 | Foodliner/Quest Liner
|
277,471 | - | 1,190 | 1,183 | 2,233 |
| 87 | 92 | Hirschbach Motor Lines
|
278,494 | - | 800 | 1,250 | 1,965 |
| 86 | 88 | TransAm Trucking
|
280,000 | - | 1,135 | 1,823 | |
| 85 | 83 | Cassens Transport Co.
|
302,004 | - | 1,265 | 1,231 | 1,231 |
| 84 | 94 | Salmon Cos.
|
314,303 | - | 713 | 1,092 | |
| 83 | 82 | Dicom Transportation Group
|
320,700 | - | |||
| 82 | 84 | IMC Cos.
|
332,490 | - | 2,300 | 1,658 | 148 |
| 81 | 87 | Transport Investments
|
339,920 | - | 190 | 1,037 | 1,846 |
| 80 | 80 | Maverick USA
|
352,068 | - | 2,122 | 1,648 | 2,480 |
| 79 | 78 | A. Duie Pyle Inc.
|
373,000 | - | 2,697 | 946 | 1,936 |
| 78 | 76 | Roehl Transport
|
384,473 | - | 2,336 | 1,983 | 4,873 |
| 77 | LaserShip Inc./OnTrac Inc.
|
400,000 | - | 29 | 27 | ||
| 76 | 81 | Epes Carriers Inc.
|
400,977 | 26,309 | 1,272 | 6,065 | |
| 75 | 79 | Black Horse Carriers
|
412,500 | - | 3,150 | 1,670 | 3,500 |
| 74 | 73 | TMC Transportation
|
413,000 | - | 2,613 | 3,404 | |
| 73 | 71 | TransX Group of Companies
|
415,541 | - | 2,617 | 1,365 | 4,410 |
| 72 | 72 | Mesilla Valley Transportation
|
430,261 | - | 1,760 | 1,450 | 6,000 |
| 71 | 68 | P.A.M. Transport
|
437,838 | 38,899 | 2,409 | 2,281 | 5,795 |
| 70 | 66 | Shevell Group
|
439,500 | - | 3,745 | 1,550 | 3,950 |
| 69 | 70 | USA Truck (DB Schenker)
|
446,533 | 7,497 | 2,400 | 1,669 | 5,596 |
| 68 | 64 | Dart Transit Co.
|
451,925 | - | 2,626 | 2,131 | 7,159 |
| 67 | 10 Roads Express
|
452,429 | - | 1,935 | 2,421 | ||
| 66 | 67 | Cowan Systems
|
462,544 | - | 1,946 | 2,122 | 5,677 |
| 65 | 74 | Bison Transport
|
472,004 | - | 2,944 | 1,704 | 4,732 |
| 64 | Two Men and a Truck Movers
|
487,236 | - | 6,136 | |||
| 63 | 63 | Mercer Transportation Co.
|
492,509 | - | 293 | 2,299 | 2,299 |
| 62 | 69 | Bennett International Group
|
512,874 | - | 1,023 | 1,345 | 2,126 |
| 61 | 62 | Canada Cartage System
|
546,309 | - | 3,137 | 2,548 | 2,817 |
| 60 | 54 | Suddath
|
550,000 | - | |||
| 59 | 60 | Dayton Freight Lines
|
562,000 | - | 4,501 | 1,561 | 3,803 |
| 58 | 55 | Western Express
|
566,230 | 41,998 | 2,850 | 2,555 | 7,800 |
| 57 | 56 | OnTrac Inc.
|
572,856 | - | 36 | 950 | |
| 56 | 45 | Trimac Transportation
|
576,796 | - | 3,200 | 1,720 | 3,800 |
| 55 | 61 | PS Logistics
|
595,780 | - | 3,000 | 2,500 | |
| 54 | 48 | Jack Cooper Holdings
|
602,825 | 74,839 | 3,753 | 2,637 | |
| 53 | 52 | Heartland Express
|
607,336 | 75,173 | 3,800 | 6,719 | 19,975 |
| 52 | 58 | Mullen Group
|
627,372 | - | 3,535 | 1,919 | 5,065 |
| 51 | 56 | United Road Services
|
645,000 | - | 1,700 | 1,850 | 1,150 |
| 50 | 53 | AAA Cooper Transportation
|
665,000 | - | 5,000 | 3,000 | 6,500 |
| 49 | 49 | Stevens Transport
|
694,980 | 83,845 | 2,925 | 2,810 | 4,010 |
| 48 | 46 | Marten Transport
|
698,120 | 90,284 | 3,492 | 2,738 | 4,909 |
| 47 | 47 | Covenant Logistics Group
|
705,007 | 55,439 | 4,297 | 2,700 | 7,389 |
| 46 | 50 | Pitt Ohio Transportation Group
|
715,827 | - | 5,381 | 1,856 | 5,372 |
| 45 | 51 | Day & Ross
|
718,941 | - | 2,240 | 1,800 | 5,714 |
| 44 | 36 | Cardinal Logistics
|
720,000 | - | 4,245 | 2,905 | 7,940 |
| 43 | 44 | Central Transport International
|
754,000 | - | 3,180 | 6,543 | |
| 42 | 43 | Quality Carriers
|
786,000 | - | 2,541 | 5,204 | |
| 41 | 40 | Ruan
|
836,298 | - | 5,500 | 2,900 | 8,710 |
| 40 | 41 | Atlas World Group
|
842,100 | 4,800 | 671 | 1,271 | 4,076 |
| 39 | 59 | Evans Delivery
|
898,000 | - | 376 | 5,014 | 550 |
| 38 | 39 | Lynden
|
950,000 | - | 2,600 | 768 | 2,889 |
| 37 | 38 | KLLM Transport Services
|
959,000 | - | 3,800 | 5,700 | |
| 36 | 34 | Anderson Trucking Service
|
1,004,301 | - | 1,996 | 2,652 | 6,958 |
| 35 | 33 | Celadon Group Inc.
|
1,065,356 | - | 5,200 | 3,850 | 10,000 |
| 34 | 35 | Crete Carrier Corp.
|
1,100,000 | - | 6,000 | 5,400 | 14,000 |
| 33 | 37 | Forward Air
|
1,100,816 | 87,321 | 4,898 | 964 | 6,464 |
| 32 | 31 | Averitt Express
|
1,146,970 | 98,967 | 8,500 | 4,513 | 14,585 |
| 31 | 32 | Universal Logistics Holdings
|
1,216,665 | 28,153 | 8,231 | 3,784 | 5,765 |
| 30 | 29 | Southeastern Freight Lines
|
1,260,050 | - | 8,792 | 3,635 | 11,697 |
| 29 | 42 | Daseke Inc.
|
1,300,000 | 26,996 | 4,700 | 5,200 | 11,500 |
| 28 | 20 | Purolator
|
1,343,111 | - | 10,000 | 465 | 1,329 |
| 27 | 28 | Saia Inc.
|
1,378,510 | 91,156 | 9,800 | 4,259 | 13,901 |
| 26 | 21 | Sirva Inc.
|
1,400,000 | - | |||
| 25 | 26 | C.R. England
|
1,405,411 | - | 7,975 | 4,213 | 6,116 |
| 24 | 25 | Kenan Advantage Group
|
1,441,440 | - | 9,000 | 6,686 | 10,744 |
| 23 | 19 | CRST The Transportation Solution
|
1,555,000 | - | 7,538 | 5,774 | 12,145 |
| 22 | 24 | R+L Carriers
|
1,580,000 | - | 5,084 | 15,675 | |
| 21 | 21 | U.S. Xpress Enterprises
|
1,600,000 | - | 9,522 | 6,600 | 16,800 |
| 19 | 21 | Penske Logistics
|
1,700,000 | - | 18,011 | 2,935 | 9,108 |
| 19 | 17 | UniGroup
|
1,700,000 | - | |||
| 18 | 18 | Prime Inc.
|
1,875,031 | 208,184 | 4,300 | 6,296 | 12,753 |
| 17 | 27 | NFI
|
1,910,000 | - | 10,000 | 4,000 | 8,900 |
| 16 | 15 | Roadrunner Freight
|
2,091,300 | -91,200 | 4,600 | 3,625 | 6,920 |
| 15 | 16 | Werner Enterprises
|
2,116,737 | 92,000 | 12,154 | 7,480 | 24,500 |
| 14 | 14 | Estes Express Lines
|
2,740,000 | - | 17,397 | 6,695 | 27,443 |
| 13 | 12 | ArcBest
|
2,826,457 | 59,726 | 13,000 | 4,436 | 22,275 |
| 12 | 13 | Ryder Supply Chain Solutions
|
3,065,500 | 158,400 | |||
| 11 | 11 | Old Dominion Freight Line
|
3,358,112 | 463,774 | 20,944 | 8,316 | 32,890 |
| 10 | 9 | Landstar System
|
3,646,364 | 177,088 | 1,273 | 9,438 | 15,534 |
| 9 | 10 | TFI International
|
3,906,575 | 130,181 | 17,044 | 16,132 | 24,617 |
| 8 | 9 | Hub Group
|
4,034,897 | 135,153 | 4,377 | 3,520 | 5,850 |
| 7 | 6 | Schneider
|
4,383,600 | 389,900 | 19,600 | 11,859 | 37,637 |
| 6 | 5 | Yellow Corp.
|
4,891,000 | -10,800 | 32,000 | 14,100 | 44,600 |
| 5 | 30 | Knight-Swift Transportation Holdings
|
5,136,261 | 529,922 | 25,400 | 23,069 | 74,949 |
| 4 | 4 | J.B. Hunt Transport Services
|
7,189,568 | 385,308 | 27,670 | 14,392 | 32,931 |
| 3 | 3 | XPO
|
15,380,800 | 312,400 | 95,000 | 16,287 | 27,591 |
| 2 | 2 | FedEx Corp.
|
63,864,000 | 4,465,000 | 425,000 | 29,873 | 113,218 |
| 1 | 1 | UPS Inc.
|
65,872,000 | 4,910,000 | 454,000 | 18,683 | 97,746 |
Top For-Hire Carriers on this list are common and contract freight carriers operating in the United States, Canada and Mexico. Companies are ranked on the basis of annual revenue. To be included in the Top 100 or any of the sectors, please send contact information to tteditor@ttnews.com. We will contact you via phone or e-mail to get information about your company prior to publication of the next Top 100 list.
* Tractor count includes company-owned, lease-to-own and owner-operator tractors.
On the Bubble


U.S. Xpress Reports $554M Revenue for Q2
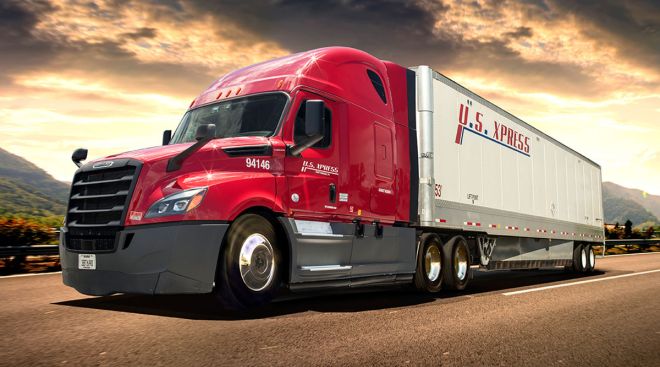
U.S. Xpress Enterprises posted revenue gains but sluggish earnings during the second quarter of 2022, the company reported Aug. 3.
Werner Enterprises Reports Record for Q2

Werner Enterprises achieved its eighth consecutive quarter of record earnings per share during the second quarter of 2022, the company reported Aug. 3.
Schneider Launches Digital Marketplace for Bulk Shippers

Schneider National launched a new digital marketplace that aims to give bulk shippers more flexibility and visibility, the carrier announced Aug. 4.
August 4, 2022Daseke Reports Mixed Results in Second Quarter
Daseke Inc. saw a decline in earnings despite revenue gains during the second quarter of 2022, the company reported Aug. 2.
Aurora Adds Fourth Fleet Partner for Autonomous Pilot
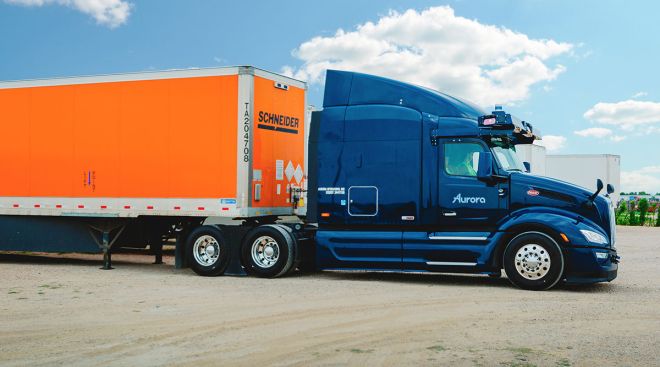
Autonomous technology developer Aurora Innovation Inc. and Schneider National Inc. have announced a commercial pilot effort to haul freight for Schneider’s customers with Aurora Driver, Aurora’s autonomous technology.
Universal Logistics Reports Record-Breaking Q2
Universal Logistics Holdings reported all-time highs for revenue, operating income and earnings per share in its second-quarter earnings report July 28.
ArcBest Reports Record-Setting Quarter for Q2
ArcBest Corp. posted records for quarterly revenue, operating income and net income for the second quarter of 2022.
Schneider Reports $1.75 Billion Revenue for Q2
Schneider National posted increases in revenue and earnings during the second quarter of 2022, the company reported July 28.
Forward Air Reports Record-Setting Quarter for Q2
Forward Air Corp. on July 27 reported all-time quarterly records for revenue, income from operations and net income per diluted share for the second quarter.
ODFL Reports Profit, Revenue Records for Second Quarter
Old Dominion Freight Line set records for revenue and profitability during the second quarter of 2022, the company reported July 27.
-

2022
-
2021
-
2020
-
2019
-
2018
-
2017
-
2016
-
2015
-
2014
-
2013
-
2012
-
2011
-
2010
-
2009
-
2008
-
2007
-
2006
-
2005
-
2004


