


| Rank This Year | Rank Last Year | Company | Revenue (000) | Net Income (000) | Employees | Tractors* | Trailers |
|---|---|---|---|---|---|---|---|
| 1 | 1 | UPS Inc.
|
71,861,000 | 4,791,000 | 481,000 | 19,732 | 106,481 |
| 2 | 2 | FedEx Corp.
|
69,200,000 | 3,636,000 | 425,000 | 29,813 | 113,218 |
| 3 | 3 | XPO
|
17,279,000 | 390,000 | 100,000 | 14,438 | 25,689 |
| 4 | 4 | J.B. Hunt Transport Services
|
8,614,874 | 489,585 | 28,300 | 15,808 | 33,510 |
| 5 | 5 | Knight-Swift Transportation Holdings
|
5,344,066 | 456,070 | 22,800 | 19,156 | 69,544 |
| 6 | 6 | Yellow Corp.
|
5,092,000 | 20,200 | 31,000 | 14,100 | 45,000 |
| 7 | 7 | Schneider
|
4,977,000 | 268,900 | 19,400 | 13,700 | 37,800 |
| 8 | 10 | Landstar System
|
4,615,144 | 255,281 | 1,306 | 10,599 | 16,743 |
| 9 | 11 | Old Dominion Freight Line
|
4,043,695 | 605,668 | 22,858 | 9,254 | 35,729 |
| 10 | 9 | TFI International
|
3,954,008 | 225,356 | 17,127 | 15,992 | 26,487 |
| 11 | 12 | Ryder Supply Chain Solutions
|
3,731,457 | 194,806 | |||
| 12 | 8 | Hub Group
|
3,683,593 | 201,740 | 5,400 | 3,800 | 5,000 |
| 13 | 14 | Estes Express Lines
|
3,160,000 | - | 18,451 | 7,569 | 29,519 |
| 14 | 13 | ArcBest
|
3,093,788 | 67,262 | 13,000 | 4,273 | 22,680 |
| 15 | 15 | Werner Enterprises
|
2,457,914 | 168,148 | 12,852 | 7,860 | 25,255 |
| 16 | 19 | Penske Logistics
|
2,300,000 | - | 19,012 | 3,491 | 10,162 |
| 17 | 16 | Roadrunner Freight
|
2,216,141 | -165,597 | 4,600 | 3,422 | 5,563 |
| 18 | 18 | Prime Inc.
|
2,186,057 | 306,419 | 4,900 | 7,226 | 13,524 |
| 19 | 17 | NFI
|
2,040,000 | - | 10,900 | 4,000 | 9,700 |
| 20 | 21 | U.S. Xpress Enterprises
|
1,842,817 | 26,106 | 8,912 | 6,909 | 16,000 |
| 21 | 29 | Daseke Inc.
|
1,770,000 | -5,187 | 5,930 | 6,144 | 13,824 |
| 22 | 19 | UniGroup
|
1,700,000 | - | 5,022 | 5,607 | |
| 23 | 22 | R+L Carriers
|
1,692,000 | - | 5,084 | 15,675 | |
| 24 | 23 | CRST The Transportation Solution
|
1,685,000 | - | 7,131 | 6,052 | 14,077 |
| 25 | 27 | Saia Inc.
|
1,653,849 | 104,981 | 10,300 | 4,834 | 15,483 |
| 26 | 25 | C.R. England
|
1,636,138 | - | 8,196 | 4,287 | 6,494 |
| 27 | 24 | Kenan Advantage Group
|
1,536,191 | - | 9,000 | 6,409 | 10,732 |
| 28 | 31 | Universal Logistics Holdings
|
1,461,708 | 52,178 | 6,335 | 4,057 | 6,152 |
| 29 | 26 | Sirva Inc.
|
1,400,000 | - | 1,657 | 2,867 | |
| 30 | 30 | Southeastern Freight Lines
|
1,378,929 | - | 8,989 | 3,570 | 11,569 |
| 31 | 32 | Forward Air
|
1,320,886 | 92,051 | 5,411 | 1,185 | 6,647 |
| 32 | 32 | Averitt Express
|
1,298,463 | - | 9,000 | 4,947 | 15,182 |
| 33 | 36 | Anderson Trucking Service
|
1,244,459 | - | 2,143 | 2,636 | 6,978 |
| 34 | 39 | Evans Delivery
|
1,163,625 | - | 429 | 6,000 | 550 |
| 35 | 34 | Crete Carrier Corp.
|
1,156,000 | - | 6,000 | 5,373 | 13,430 |
| 36 | 28 | Purolator
|
1,078,043 | - | 10,000 | 465 | 1,329 |
| 37 | 38 | Lynden
|
1,050,000 | - | 2,658 | 998 | 2,679 |
| 38 | 35 | Celadon Group Inc.
|
999,700 | - | 5,500 | 3,850 | 10,000 |
| 39 | 41 | Ruan
|
957,131 | - | 5,700 | 3,700 | 9,600 |
| 40 | 37 | KLLM Transport Services
|
917,000 | - | 3,500 | 5,400 | |
| 41 | 40 | Atlas World Group
|
900,500 | 10,000 | 650 | 1,064 | 4,136 |
| 42 | 47 | Covenant Logistics Group
|
885,455 | 42,503 | 5,500 | 3,154 | 6,950 |
| 43 | 46 | Pitt Ohio Transportation Group
|
826,947 | - | 5,751 | 2,047 | 5,534 |
| 44 | 43 | Central Transport International
|
825,000 | - | 3,180 | 6,543 | |
| 45 | 42 | Quality Carriers
|
822,000 | - | 2,541 | 5,204 | |
| 46 | 45 | Day & Ross
|
806,806 | - | 3,277 | 2,872 | 9,006 |
| 47 | 44 | Cardinal Logistics
|
800,000 | - | 4,220 | 2,560 | 8,000 |
| 48 | 48 | Marten Transport
|
787,594 | 55,027 | 3,600 | 2,661 | 5,594 |
| 49 | 55 | PS Logistics
|
747,339 | - | 3,664 | 3,150 | 5,300 |
| 50 | 50 | AAA Cooper Transportation
|
725,000 | - | 5,234 | 2,690 | 6,800 |
| 51 | 49 | Stevens Transport
|
719,870 | 102,660 | 2,700 | 2,715 | 3,900 |
| 52 | 58 | Western Express
|
695,122 | - | 3,250 | 2,805 | 7,600 |
| 53 | 52 | Mullen Group
|
674,027 | - | 3,759 | 1,978 | 5,055 |
| 54 | 51 | United Road Services
|
659,000 | - | 1,846 | 2,550 | 1,300 |
| 54 | 59 | Dayton Freight Lines
|
659,000 | 89,577 | 4,922 | 1,752 | 4,408 |
| 56 | 62 | Bennett International Group
|
612,140 | - | 1,124 | 1,632 | 2,698 |
| 57 | 53 | Heartland Express
|
610,803 | 72,677 | 3,450 | 2,906 | 10,506 |
| 58 | 63 | Mercer Transportation Co.
|
602,504 | - | 305 | 2,608 | 2,608 |
| 59 | 60 | Suddath
|
600,000 | - | 2,200 | ||
| 60 | 54 | Jack Cooper Holdings
|
581,000 | - | 3,753 | 1,843 | 2,290 |
| 61 | 57 | OnTrac Inc.
|
562,856 | - | 23 | 900 | |
| 62 | 65 | Bison Transport
|
556,684 | - | 3,100 | 1,697 | 5,096 |
| 63 | 66 | Cowan Systems
|
537,163 | - | 2,107 | 2,073 | 5,785 |
| 64 | 69 | USA Truck (DB Schenker)
|
534,060 | 12,204 | 2,400 | 1,674 | 5,531 |
| 65 | 71 | P.A.M. Transport
|
533,261 | 23,994 | 2,748 | 2,031 | 6,397 |
| 66 | 56 | Trimac Transportation
|
528,672 | - | 3,165 | 1,966 | 4,080 |
| 67 | 61 | Canada Cartage System
|
501,659 | - | 3,160 | 3,309 | 2,817 |
| 68 | 68 | Dart Transit Co.
|
491,912 | - | 2,362 | 2,068 | 7,408 |
| 69 | 75 | Black Horse Carriers
|
491,000 | - | 3,438 | 1,700 | 4,000 |
| 70 | 64 | Two Men and a Truck Movers
|
487,236 | - | 6,334 | ||
| 71 | 67 | 10 Roads Express
|
480,806 | - | 1,857 | 2,281 | |
| 72 | 74 | TMC Transportation
|
464,000 | - | 2,752 | 3,691 | |
| 73 | 87 | Hirschbach Motor Lines
|
454,454 | - | 1,213 | 1,860 | 3,490 |
| 74 | 77 | LaserShip Inc./OnTrac Inc.
|
435,000 | - | 14 | 10 | |
| 75 | 79 | A. Duie Pyle Inc.
|
428,800 | - | 2,851 | 1,083 | 2,086 |
| 76 | 78 | Roehl Transport
|
421,330 | - | 2,460 | 1,966 | 4,902 |
| 77 | 80 | Maverick USA
|
395,771 | - | 2,156 | 1,632 | 2,446 |
| 78 | 81 | Transport Investments
|
384,719 | - | 200 | 1,035 | 1,899 |
| 79 | 72 | Mesilla Valley Transportation
|
383,950 | - | 1,662 | 1,400 | 5,000 |
| 80 | 82 | IMC Cos.
|
368,560 | - | 2,001 | 1,455 | 148 |
| 81 | Red Classic
|
354,416 | - | 1,211 | 546 | 2,647 | |
| 82 | 88 | Foodliner/Quest Liner
|
317,062 | - | 1,301 | 1,279 | 2,301 |
| 83 | 89 | Koch Cos.
|
310,000 | - | 1,167 | 1,155 | 5,432 |
| 84 | 86 | TransAm Trucking
|
307,000 | - | 1,135 | 1,823 | |
| 85 | 92 | Melton Truck Lines
|
302,227 | - | 1,701 | 1,359 | 2,276 |
| 86 | 91 | Trans-System Inc.
|
300,000 | - | 1,100 | 1,000 | 1,870 |
| 86 | ContainerPort Group
|
300,000 | - | 400 | 1,400 | 100 | |
| 86 | RoadOne IntermodaLogistics
|
300,000 | - | 1,700 | 200 | ||
| 89 | 99 | John Christner Trucking
|
295,171 | 24,907 | 207 | 801 | 1,103 |
| 90 | Heniff Transportation Systems
|
293,000 | - | 1,100 | 3,000 | ||
| 91 | 85 | Cassens Transport Co.
|
292,635 | - | 1,126 | 1,150 | 1,150 |
| 92 | 90 | Dependable Supply Chain Services
|
291,000 | - | 346 | 1,113 | |
| 93 | Hansen & Adkins Auto Transport
|
290,935 | - | 1,137 | 1,139 | ||
| 94 | 100 | Acme Truck Line
|
290,475 | - | 2,000 | 900 | 1,000 |
| 95 | 95 | Quantix Supply Chain Solutions
|
285,000 | - | 1,100 | 858 | 1,132 |
| 95 | 96 | Challenger Motor Freight
|
285,000 | - | 1,875 | 1,530 | 3,350 |
| 97 | 94 | Martin Transportation Systems
|
282,483 | - | 2,179 | 1,261 | 2,592 |
| 98 | PGT Trucking
|
280,000 | - | 675 | 1,020 | 1,820 | |
| 99 | 98 | Superior Bulk Logistics
|
277,000 | - | 1,100 | 2,000 | |
| 100 | 97 | United Vision Logistics
|
275,000 | - | 977 | 1,217 |
Top For-Hire Carriers on this list are common and contract freight carriers operating in the United States, Canada and Mexico. Companies are ranked on the basis of annual revenue. To be included in the Top 100 or any of the sectors, please send contact information to tteditor@ttnews.com. We will contact you via phone or e-mail to get information about your company prior to publication of the next Top 100 list.
* Tractor count includes company-owned, lease-to-own and owner-operator tractors.

On the Bubble


Estes Express Says It Is Doing Well Post-Cyberattack
Executives from Estes Express Lines recently shared details and lessons learned about the company’s response after an October cyberattack hampered the carrier’s operations.
Forward Air Files Counterclaim Against Omni on Merger
Forward Air has filed a counterclaim against Omni Logistics in response to a lawsuit Omni filed alleging that Forward has not followed through on a planned merger between the companies.
Werner Enterprises Reports Earnings Drop on Steady Revenue
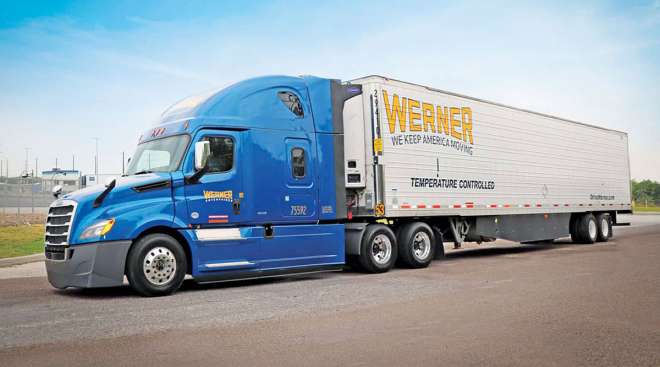
Werner Enterprises experienced a year-over-year drop in earnings on a slight decrease in revenue during the third quarter, the company reported Nov. 1.
Forward Air Reports 82% Earnings Drop During Q3
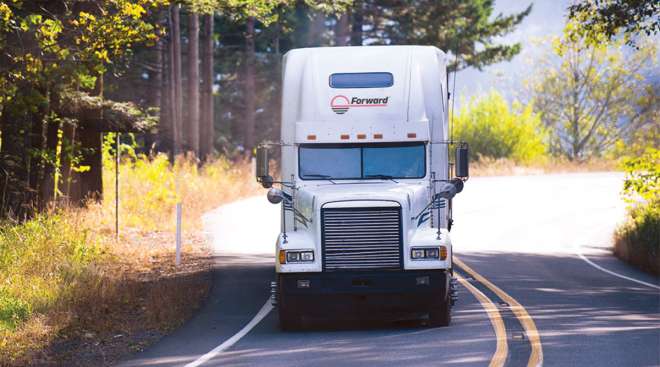
Forward Air Corp. reported an 82.2% drop in earnings during the third quarter of 2023 as revenue declined amid a weak freight environment, the company reported Oct 30.
Jack Cooper Making $2 Billion Bid for Bankrupt Yellow
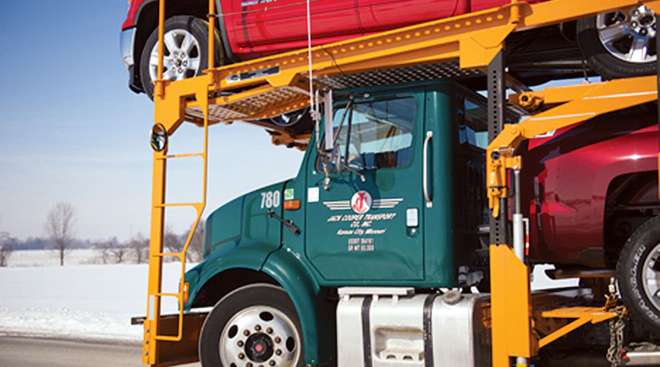
Jack Cooper Transport is reportedly making a nearly $2 billion bid to snatch up the assets of Yellow, the trucking firm that collapsed in late July and filed for bankruptcy.
Court Approves Yellow Administrators’ Auction Plans

A court on Oct. 27 approved plans by the administrators of Yellow to use auctioneers to sell the company’s rolling stock, as Jack Cooper Transport eyes a bid to rescue the motor carrier.
XPO Reports Revenue Increase Despite Tough Conditions
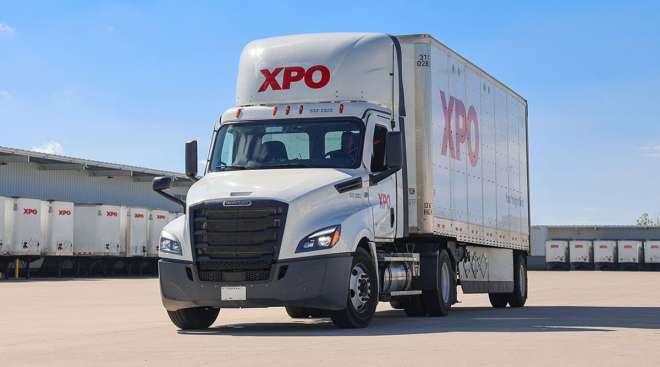
XPO posted an increase in revenue but a dip in profit during the third quarter amid a challenging freight environment, the company said Oct 30.
Universal Reports Revenue Decline Amid Q3 Headwinds
Universal Logistics Holdings experienced an overall decrease in revenue, with each segment facing year-over-year declines for the third quarter of 2023, the company reported Oct 26.
Ryder Reports Slight Revenue Decline for Q3
Ryder System Inc. experienced a slight decline in year-over-year revenue amid market headwinds during the third quarter of 2023, the company reported Oct. 25.
Estes Express IT System Fully Restored, COO Says
Estes Express Lines’ information technology systems are “completely restored” after a cyberattack earlier in October, according to Chief Operating Officer Webb Estes.
-

2022
-
2021
-
2020
-
2019
-
2018
-
2017
-
2016
-
2015
-
2014
-
2013
-
2012
-
2011
-
2010
-
2009
-
2008
-
2007
-
2006
-
2005
-
2004


