


Top 100 Private | Food Service | Grocery | Beverage | Petroleum/Chemical | Industrial Gases | Agriculture/Food Processing | Wholesale/Retail | Manufacturing
Equipment Rental | Building Materials | Waste Management | Paper/Office Products | Construction | Health Care | Uniform Rental | Media & Entertainment
| Rank This Year | Rank Last Year | Company | Tractors | Trucks | Pickups/ Cargo Vans | Trailers | Annual Revenue |
|---|---|---|---|---|---|---|---|
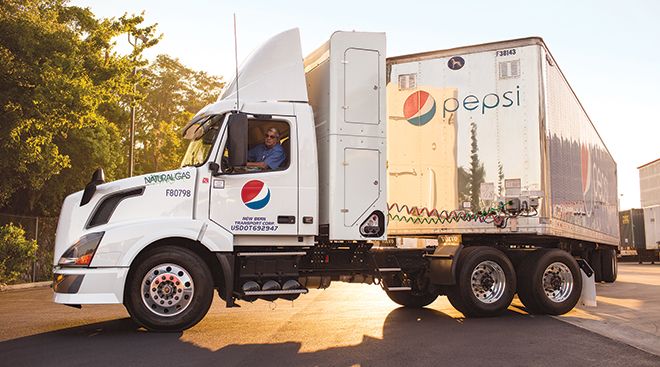
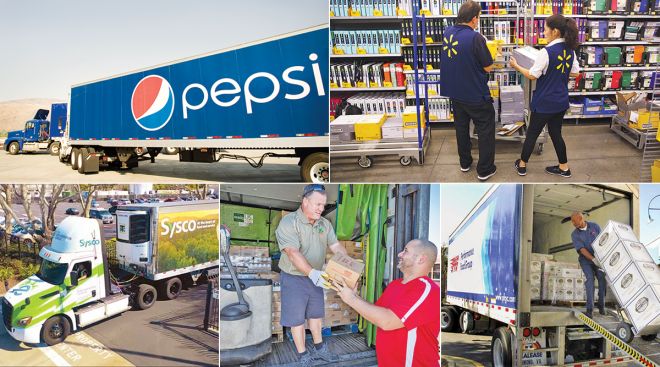
| 1 | 1 | PepsiCo Inc. |
10,870 | 4,658 | 16,137 | 19,430 | $70.4 billion |
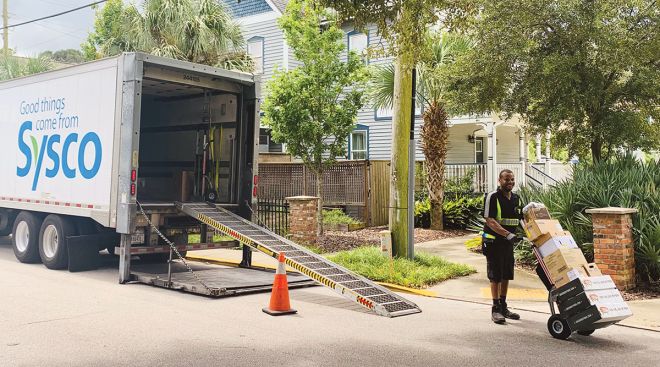
| 2 | 2 | Sysco Corp. |
8,745 | 1,345 | 840 | 10,593 | $52.9 billion |
| 3 | 3 | Walmart Inc. |
7,400 | 25 | - | 58,826 | $559.2 billion |
| 4 | 4 | Halliburton Co. |
5,677 | 2,793 | - | 11,136 | $14.4 billion |
| 5 | 5 | US Foods |
5,426 | 375 | - | 7,096 | $22.9 billion |
| 6 | 6 | Reyes Holdings |
5,104 | 826 | 1,249 | 6,846 | $29.0 billion |
| 7 | 7 | Performance Food Group |
4,767 | 508 | - | 6,091 | $25.1 billion |
| 8 | 8 | McLane Co. |
3,852 | 109 | 31 | 5,833 | $46.8 billion |
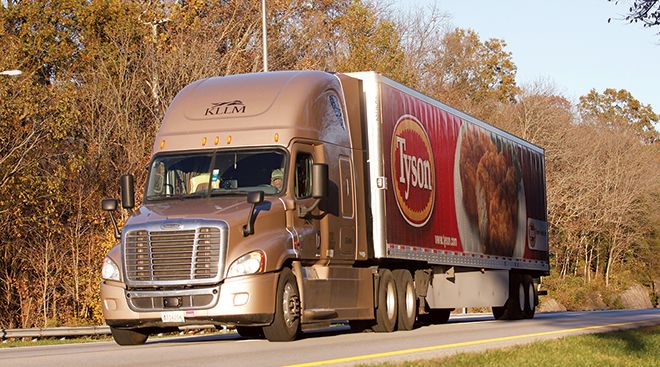
| 9 | 11 | Tyson Foods |
2,594 | 46 | - | 5,024 | $43.2 billion |
| 10 | 25 | Helena Agri-Enterprises |
2,552 | 1,792 | - | 2,670 | - |
| 11 | 10 | NexTier Oilfield Solutions |
2,436 | 424 | - | 3,373 | $1.2 billion |
| 12 | 13 | Basic Energy Services |
2,218 | 642 | - | 1,880 | $0.4 billion |
| 13 | 9 | Schlumberger Limited |
2,101 | 363 | - | 5,582 | $23.6 billion |
| 14 | 12 | United Rentals |
2,047 | 3,730 | - | 2,361 | $8.5 billion |
| 15 | 14 | Gordon Food Service |
1,875 | 16 | - | 2,695 | $14.0 billion |
| 16 | 19 | Coca-Cola Bottling Co. United |
1,595 | 554 | - | 1,854 | - |
| 17 | 18 | American Air Liquide Holdings |
1,586 | 3,858 | - | 2,203 | $23.4 billion |
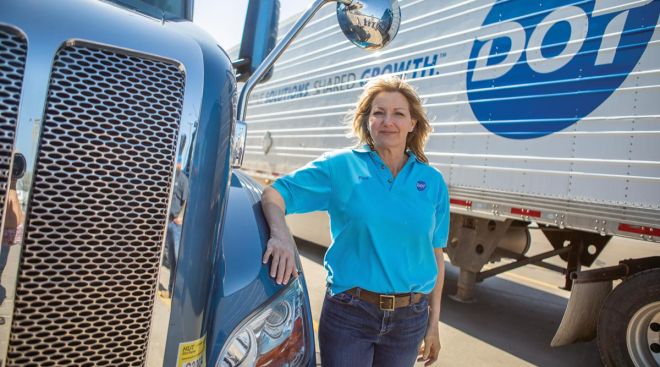
| 18 | 17 | Dot Foods |
1,568 | 10 | 40 | 2,645 | - |
| 19 | 20 | United Natural Foods Inc. (UNFI) |
1,548 | 6 | - | 4,701 | $26.5 billion |
| 20 | 16 | Sunbelt Rentals |
1,537 | 3,517 | - | 1,507 | $5.4 billion |
| 21 | 15 | CHS Inc. |
1,534 | 1,868 | - | 5,746 | $28.4 billion |
| 22 | Amazon.com Inc. |
1,395 | 12,373 | - | 37,390 | $386.1 billion |
|
| 23 | 22 | The Quikrete Cos. |
1,348 | 5 | - | 2,051 | - |
| 24 | 23 | Pilot Co. |
1,341 | 28 | - | 1,688 | - |
| 25 | 27 | Cemex USA |
1,229 | 3,597 | - | 2,257 | $6.8 billion |
| 26 | 36 | Ashley Furniture Industries |
1,215 | 78 | 6 | 4,040 | - |
| 27 | 30 | Clean Harbors |
1,172 | 4,444 | - | 3,915 | $3.1 billion |
| 28 | 28 | ProPetro Holding Corp. |
1,156 | 32 | - | 1,662 | $0.8 billion |
| 29 | 29 | Ahold USA/Delhaize America |
1,149 | 724 | - | 4,577 | $51.8 billion |
| 30 | 24 | Cudd Energy Services |
1,126 | 291 | - | 1,399 | - |
| 31 | 58 | Prairie Farms Dairy |
1,120 | 1,649 | 318 | 3,671 | - |
| 32 | 32 | Core-Mark Holding Co. |
1,099 | 137 | - | 1,315 | $17.0 billion |
| 33 | 31 | Ben E. Keith Co. |
1,094 | 73 | - | 1,348 | - |
| 34 | 33 | FTS International |
1,083 | 74 | - | 1,343 | $0.3 billion |
| 35 | 46 | Energy Transfer Partners |
1,075 | 101 | - | 1,289 | $39.0 billion |
| 36 | 37 | Love's Travel Stops & Country Stores |
1,064 | - | - | 876 | - |
| 37 | 49 | Medline Inc. |
973 | 348 | - | 1,279 | $13.9 billion |
| 38 | 38 | Walgreen Co. |
959 | 23 | - | 2,595 | $139.5 billion |
| 39 | 35 | Albertsons Cos. |
948 | - | - | 3,309 | $69.7 billion |
| 40 | 39 | The Kroger Co. |
943 | 15 | - | 14,078 | $132.5 billion |
| 41 | 40 | CRH Americas |
930 | 1,745 | - | 2,338 | $11.3 billion |
| 42 | 42 | Maxim Crane Works |
882 | 641 | - | 1,818 | - |
| 43 | 43 | Sherwin-Williams Co. |
861 | 1 | - | 2,119 | $18.4 billion |
| 44 | 44 | Swire Coca-Cola USA |
853 | 278 | - | 1,172 | $2.3 billion |
| 45 | 45 | BlueLinx Holdings |
836 | 44 | - | 848 | $3.1 billion |
| 46 | 52 | ABC Supply Co. |
820 | 3,050 | - | 1,150 | $12.1 billion |
| 46 | 48 | Darling Ingredients |
820 | 710 | 245 | 4,340 | $3.6 billion |
| 48 | 47 | Mondelez International |
808 | 64 | - | 1,031 | $8.2 billion |
| 49 | 21 | Univar Solutions |
769 | 65 | - | 2,047 | $6.6 billion |
| 50 | 61 | Anheuser-Busch Cos. |
759 | 148 | - | 800 | $15.6 billion |
| 51 | 60 | Shaw Industries Group |
750 | 55 | - | 3,000 | - |
| 52 | 56 | Calfrac Well Services |
740 | 203 | - | 1,067 | $0.5 billion |
| 53 | 57 | JBS USA Holdings |
739 | - | - | 1,336 | - |
| 54 | 59 | Southern Glazer's Wine & Spirits |
721 | 2,189 | - | 820 | - |
| 55 | WillScot Mobile Mini Holdings Corp. |
707 | 274 | - | 1,272 | $1.4 billion |
|
| 56 | 55 | Shamrock Foods Co. |
696 | 107 | - | 1,028 | - |
| 57 | 54 | Brenntag North America |
691 | 474 | - | 2,158 | $4.8 billion |
| 58 | 64 | Publix Super Markets |
689 | 13 | - | 3,840 | $44.9 billion |
| 59 | 53 | Plains All American Pipeline |
680 | - | - | 840 | $23.3 billion |
| 60 | 65 | Veritiv Corp. |
661 | 53 | - | 1,026 | $6.3 billion |
| 61 | 51 | Messer Americas |
657 | 228 | 261 | 2,066 | - |
| 62 | 72 | MDU Resources Group |
651 | 2,009 | - | 2,095 | $5.5 billion |
| 63 | 63 | Coca-Cola Beverages Northeast |
644 | 77 | - | 909 | - |
| 64 | 79 | SE Independent Delivery Services |
637 | 250 | - | 2,155 | - |
| 65 | 69 | Advanced Drainage Systems |
620 | 1 | - | 1,195 | $1.7 billion |
| 66 | 87 | Costco Wholesale Corp. |
611 | 320 | - | 4,725 | $163.2 billion |
| 67 | 67 | Stericycle Inc. |
603 | 4,186 | - | 2,555 | $2.7 billion |
| 68 | 68 | Mohawk Industries |
595 | 156 | - | 2,544 | $9.6 billion |
| 69 | 71 | Beacon Roofing Supply |
579 | 1,837 | - | 1,232 | $6.9 billion |
| 70 | 73 | Air Products |
578 | 98 | 339 | 2,000 | $8.9 billion |
| 70 | KLX Energy Services Holdings Inc. |
578 | 993 | - | 1,061 | $0.3 billion |
|
| 72 | 73 | Coca-Cola Beverages Florida |
574 | 28 | - | 758 | - |
| 73 | 76 | Herc Rentals |
572 | 369 | - | 685 | $1.8 billion |
| 74 | 77 | H-E-B Grocery Co. |
567 | 8 | - | 3,002 | - |
| 75 | 85 | Foster Farms |
566 | 9 | - | 1,202 | - |
| 76 | 80 | Sanderson Farms |
556 | 26 | - | 664 | $3.6 billion |
| 77 | 70 | Liberty Coca-Cola Beverages |
553 | 136 | - | 722 | - |
| 78 | 78 | Ecology Auto Parts |
543 | 12 | - | 659 | - |
| 79 | 86 | SpartanNash |
538 | 4 | - | 1,225 | $9.3 billion |
| 80 | 34 | Builders FirstSource |
520 | 1,267 | - | 1,312 | $8.6 billion |
| 81 | 81 | Archer Daniels Midland Co. |
519 | - | - | 1,453 | $64.4 billion |
| 82 | 95 | The H.T. Hackney Co. |
505 | 191 | - | 740 | - |
| 83 | 83 | Ace Hardware Corp. |
500 | - | - | 1,400 | $7.8 billion |
| 84 | 93 | Columbia Distributing |
478 | 95 | - | 585 | - |
| 85 | 88 | KeHE Distributors |
472 | 1 | - | 793 | $5.0 billion |
| 86 | 96 | Bunzl Distribution USA |
457 | 32 | - | 864 | - |
| 87 | 98 | Hobby Lobby Stores Inc. |
456 | 8 | - | 1,543 | - |
| 88 | 94 | C&S Wholesale Grocers |
451 | - | - | 4,543 | - |
| 89 | 26 | Linde |
450 | 1,423 | - | 1,893 | $10.5 billion |
| 90 | 92 | Key Energy Services |
430 | 533 | - | 503 | - |
| 91 | 82 | Domino's Pizza |
419 | 48 | - | 587 | $4.1 billion |
| 92 | 62 | Nine Energy Service |
415 | 310 | - | 605 | $0.3 billion |
| 93 | Wilbur-Ellis |
403 | 856 | - | 1,167 | $3.0 billion |
|
| 94 | 90 | Valley Proteins |
402 | 128 | - | 1,342 | - |
| 95 | Thyssenkrupp North America |
399 | 537 | - | 793 | - | |
| 96 | 100 | Dunkin' |
397 | 12 | - | 450 | - |
| 97 | 91 | Bragg Cos. |
396 | - | - | 575 | - |
| 98 | Orgill Inc. |
393 | 2 | - | 1,080 | $3.0 billion |
|
| 99 | Matheson Tri-Gas |
392 | 685 | - | 918 | - | |
| 100 | Lowe's Companies Inc. |
388 | 3,464 | - | 462 | $89.6 billion |
The Top 100 Private Carriers Companies on this list operate their own trucks to carry freight and are ranked on the basis of the total number of highway tractors in the fleet. To be included in the Top 100 list, please send contact information to tteditor@ttnews.com. We will contact you via phone or e-mail to get information about your company prior to publication of the next Top 100 list.
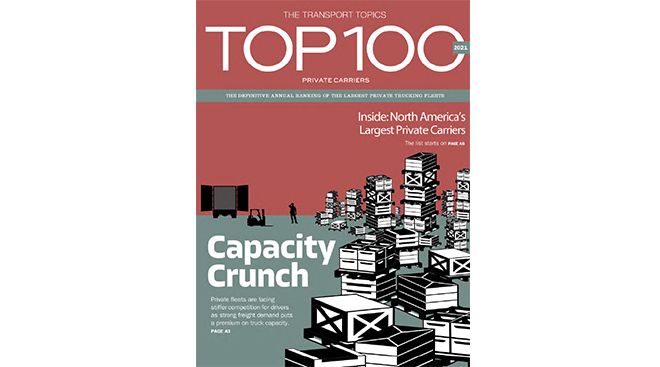
Top 100 Private Carriers Expand Fleets Despite Challenges
Even under the uncertain business environment of the past year, a majority of the companies that appear on Transport Topics’ 2022 Top 100 Private Carriers list were able to expand their fleet operations.
How to Better Manage Change When Implementing New Technologies

When it comes to implementing new technology, a common failure private fleets experience is managing “change.” Here are four things to consider to help with a successful transition
Private Fleets, Shippers Harness Digitization to Improve Operations

CHICAGO — The growing adoption of information technology in the transportation industry is creating new opportunities for shippers and private fleets to enhance logistics planning and improve the driver experience.
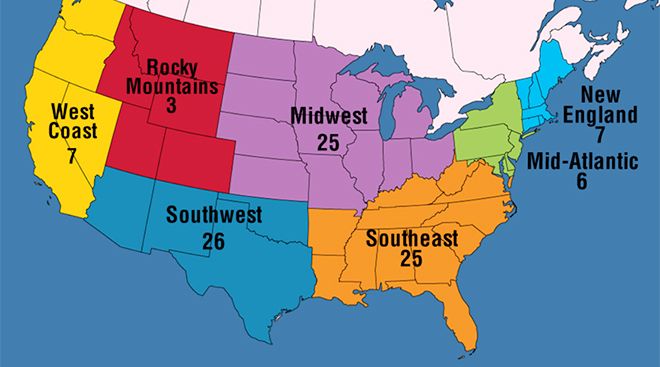
Private Fleet Sector Rankings Reflect Growth, Acquisitions
The largest private carriers in North America represent a broad range of industries, from food and beverage distribution to the oil and gas sector and just about everything in between. Here are our 2022 rankings in more than a dozen sectors.
Private Fleets Sharpen Focus on Driver Satisfaction
In light of the many supply chain disruptions and market shifts of the past few years, shippers have been working to improve the efficiency and reliability of their private fleet operations, starting with an even sharper focus on attracting and retaining professional drivers.
About Us: Transport Topics' Top 100 Private Carriers for 2022
Learn more about Transport Topics’ Top 100 Private Carriers publication.
August 26, 2022Walmart Drone Delivery Service DroneUp Expands
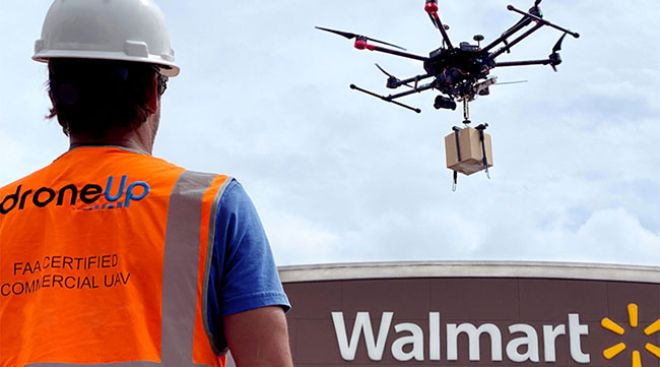
DroneUp, the sole drone partner of Walmart, announced plans to expand its headquarters and establish a research and training facility outside Petersburg, Va., creating 655 new jobs.
Pilot, Kodiak Partner on Autonomous Truck Services
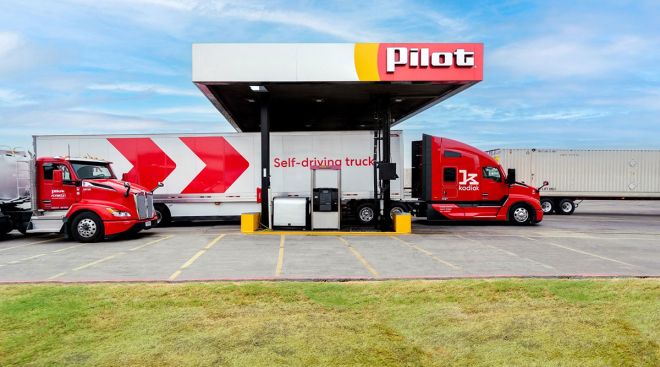
Travel center operator Pilot Co. and automated technology firm Kodiak Robotics on Aug. 23 announced formation of a partnership under which the companies will collaboratively develop autonomous truck services at Pilot and Flying J travel centers across North America.
August 23, 2022Walmart Tops Q2 Expectations as Americans Continue Spending
NEW YORK — Walmart reported better-than-expected second-quarter results as more Americans looked to cut costs on groceries at the nation’s largest retailer in the face of surging inflation.
Walmart Cuts 200 Corporate Jobs as Costs, Inventory Sap Profit
Walmart Inc. is eliminating about 200 corporate jobs as it contends with rising costs, bloated inventories and weakening demand for general merchandise.
-

2022
-
2021
-
2020
-
2019
-
2018
-
2017
-
2016
-
2015
-
2014
-
2013
-
2012
-
2011
-
2010
-
2009
-
2008
-
2007
-
2006
-
2005
-
2004


