


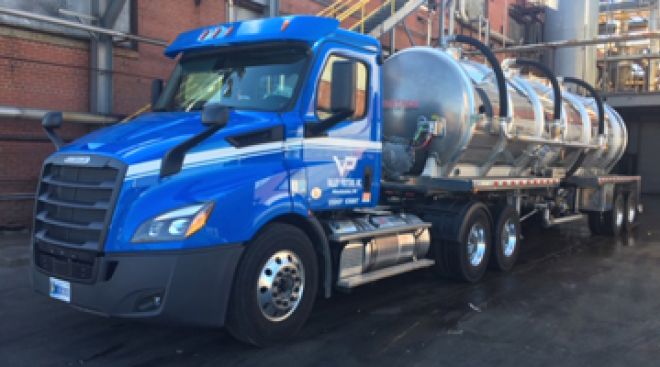
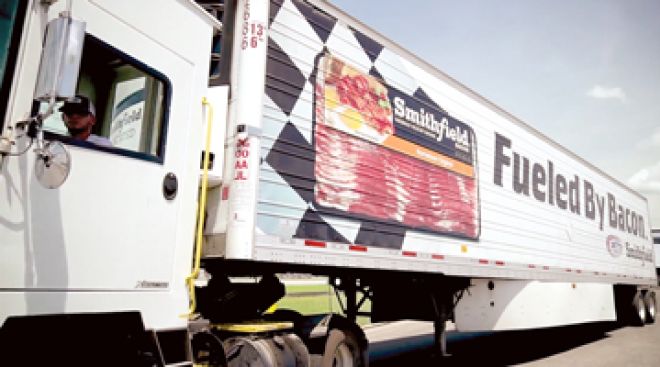
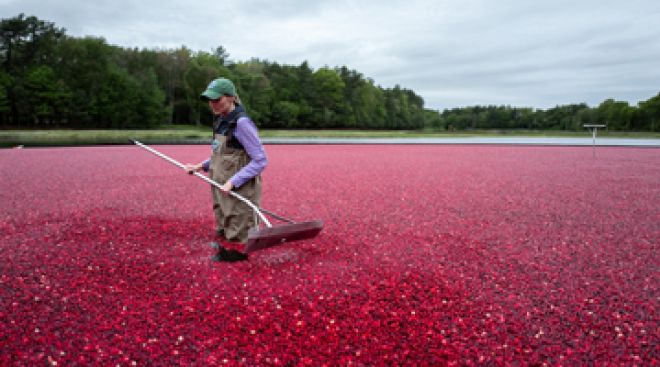
Top 100 Private | Food Service | Grocery | Beverage | Petroleum/Chemical | Industrial Gases | Agriculture/Food Processing | Wholesale/Retail | Manufacturing
Equipment Rental | Building Materials | Waste Management | Paper/Office Products | Construction | Health Care | Uniform Rental | Media & Entertainment
| Rank This Year | Rank Last Year | Company | Tractors | Trucks | Pickups/ Cargo Vans | Trailers | Annual Revenue |
|---|---|---|---|---|---|---|---|
| 1 | 1 | PepsiCo Inc. |
11,250 | 4,300 | 16,700 | 18,050 | $64.7 billion |
| 2 | 2 | Sysco Corp. |
8,544 | 1,053 | 698 | 10,478 | $58.7 billion |
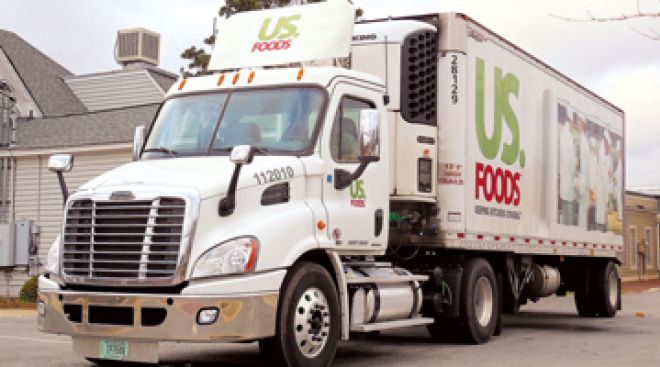
| 3 | 6 | US Foods |
6,968 | 440 | - | 8,871 | $24.2 billion |
| 4 | 3 | Walmart Inc. |
6,556 | 95 | 175 | 64,281 | $514.0 billion |
| 5 | 4 | Reyes Holdings |
5,802 | 938 | 1,292 | 7,494 | $33.0 billion |
| 6 | 5 | Halliburton Co. |
5,771 | 4,559 | 335 | 11,653 | $24.0 billion |
| 7 | 7 | Nutrien |
4,349 | 2,261 | 8,622 | 8,554 | $19.6 billion |
| 8 | 8 | McLane Co. |
3,809 | 105 | 12 | 5,758 | $50.0 billion |
| 9 | 9 | Schlumberger Limited |
3,652 | 510 | - | 5,107 | $32.8 billion |
| 10 | 10 | Performance Food Group |
3,307 | 383 | - | 4,377 | $17.6 billion |
| 11 | 11 | Tyson Foods |
3,233 | 41 | 1,433 | 8,759 | $40.1 billion |
| 12 | 15 | United Rentals |
2,774 | 5,213 | - | 3,121 | $8.0 billion |
| 13 | 13 | C&J Energy Services |
2,364 | 813 | - | 3,656 | $2.2 billion |
| 14 | 35 | Helena Agri-Enterprises |
2,054 | 1,813 | - | 2,575 | - |
| 15 | 17 | Gordon Food Service |
1,939 | 19 | - | 2,821 | $14.0 billion |
| 16 | 16 | CHS Inc. |
1,826 | 1,689 | - | 11,131 | $32.7 billion |
| 17 | 14 | Basic Energy Services |
1,686 | 386 | - | 1,822 | $1.0 billion |
| 18 | 70 | Cudd Energy Services |
1,664 | 347 | - | 2,110 | - |
| 19 | 18 | American Air Liquide Holdings |
1,489 | 4,296 | - | 2,344 | $24.5 billion |
| 20 | 20 | Coca-Cola Bottling Co. United |
1,437 | 513 | - | 1,915 | - |
| 21 | 19 | Albertsons Cos. |
1,420 | 1,050 | 75 | 5,350 | $60.6 billion |
| 22 | 22 | Dot Foods |
1,410 | 6 | 28 | 2,215 | - |
| 23 | 36 | United Natural Foods Inc. (UNFI) |
1,355 | 7 | - | 3,272 | $10.2 billion |
| 24 | 25 | Sunbelt Rentals |
1,347 | 3,195 | 3,163 | 1,346 | $4.2 billion |
| 25 | 23 | The Quikrete Cos. |
1,311 | 55 | - | 1,692 | - |
| 26 | 21 | Clean Harbors |
1,217 | 4,084 | 31 | 3,543 | $3.3 billion |
| 27 | - | Keane Group |
1,201 | 135 | - | 2,106 | $2.1 billion |
| 28 | 33 | Cemex USA |
1,166 | 5,827 | - | 1,761 | $3.7 billion |
| 28 | 34 | Praxair Inc. |
1,114 | 920 | 200 | 2,681 | $11.4 billion |
| 30 | 28 | Solistica |
1,102 | 1,100 | - | 2,130 | - |
| 31 | 27 | Core-Mark Holding Co. |
1,101 | 130 | - | 1,380 | $16.4 billion |
| 32 | 30 | Ben E. Keith Co. |
1,066 | 73 | - | 1,333 | - |
| 33 | 32 | Pilot Flying J |
1,061 | 35 | - | 1,405 | - |
| 34 | 26 | FTS International |
1,055 | 144 | - | 1,514 | $1.5 billion |
| 35 | 31 | Ahold USA/Delhaize America |
1,052 | 734 | - | 4,574 | $44.2 billion |
| 36 | 50 | Univar Solutions |
1,036 | 107 | - | 2,509 | $8.6 billion |
| 37 | 38 | Walgreen Co. |
971 | 23 | - | 2,540 | $131.5 billion |
| 38 | 39 | Maxim Crane Works |
955 | 28 | - | 1,727 | - |
| 39 | 41 | Ashley Furniture Industries |
939 | 100 | 25 | 3,500 | - |
| 40 | 37 | Builders FirstSource |
891 | 2,177 | - | 1,725 | $7.7 billion |
| 41 | 92 | CRH Americas |
889 | 1,637 | - | 2,229 | - |
| 42 | 47 | Dean Foods Co. |
881 | 860 | - | 2,654 | $7.8 billion |
| 43 | 40 | The Kroger Co. |
867 | 35 | - | 12,853 | $121.2 billion |
| 44 | 73 | Energy Transfer Partners |
852 | 68 | - | 929 | $54.0 billion |
| 45 | 42 | BlueLinx Holdings |
849 | 47 | - | 902 | $2.9 billion |
| 46 | 63 | Swire Coca-Cola USA |
838 | 499 | - | 1,181 | $2.0 billion |
| 47 | 59 | Beacon Roofing Supply |
809 | 2,307 | - | 1,349 | $6.4 billion |
| 48 | 44 | Darling Ingredients |
797 | 743 | 256 | 4,500 | $3.4 billion |
| 49 | 45 | Key Energy Services |
792 | 805 | - | 6,034 | $0.5 billion |
| 50 | 64 | Sherwin-Williams Co. |
790 | - | - | 1,896 | $17.5 billion |
| 51 | 78 | Nestle USA |
789 | 3,475 | - | 1,586 | $27.7 billion |
| 52 | 42 | Veritiv Corp. |
784 | 104 | 130 | 1,323 | $8.7 billion |
| 53 | 28 | Calfrac Well Services |
780 | 30 | - | 1,027 | $2.3 billion |
| 54 | 49 | ABC Supply Co. |
779 | 3,038 | - | 2,010 | - |
| 54 | 46 | Mondelez International |
779 | 104 | - | 996 | $25.9 billion |
| 56 | 50 | Love's Travel Stops & Country Stores |
765 | - | - | 696 | - |
| 57 | 48 | Prairie Farms Dairy |
762 | 1,225 | - | 2,432 | - |
| 58 | 52 | Plains All American Pipeline |
750 | - | - | 900 | $32.8 billion |
| 58 | 71 | ProPetro Holding Corp. |
750 | 25 | - | 606 | $1.7 billion |
| 60 | 69 | Select Energy Services |
749 | 932 | - | 1,996 | $1.5 billion |
| 61 | 77 | Brenntag North America |
732 | 468 | - | 1,804 | $5.1 billion |
| 62 | - | Messer Americas |
728 | 150 | - | 2,058 | - |
| 63 | 66 | JBS USA Holdings |
726 | - | - | 1,319 | - |
| 64 | 55 | Southern Glazer's Wine & Spirits |
719 | 2,208 | - | 1,121 | - |
| 65 | 54 | Food Services of America |
714 | 50 | - | 820 | - |
| 66 | - | Nine Energy Service |
702 | 295 | - | 863 | $0.8 billion |
| 67 | 74 | Archer Daniels Midland Co. |
700 | 12 | - | 2,400 | $64.3 billion |
| 68 | 53 | Shaw Industries Group |
695 | 55 | - | 3,212 | - |
| 69 | 65 | Anheuser-Busch Cos. |
687 | 261 | - | 754 | $14.0 billion |
| 70 | 61 | Advanced Drainage Systems |
681 | 4 | - | 1,217 | $1.4 billion |
| 71 | 62 | Coca-Cola Bottling Co. of Northern New England |
677 | 100 | - | 890 | - |
| 72 | 68 | Shamrock Foods Co. |
666 | 90 | - | 990 | - |
| 73 | 80 | Baker Hughes |
649 | 55 | - | 355 | $22.9 billion |
| 74 | 57 | SE Independent Delivery Services |
633 | 118 | - | 1,188 | - |
| 75 | 76 | Air Products |
630 | 92 | 330 | 1,939 | $8.9 billion |
| 76 | 67 | Publix Super Markets |
625 | 14 | 443 | 3,062 | $36.1 billion |
| 77 | 82 | MDU Resources Group |
616 | 2,067 | - | 2,081 | $4.5 billion |
| 78 | 85 | Gravity Oilfield Services |
614 | 285 | - | 3,387 | - |
| 79 | 79 | Williams Brothers Construction |
613 | 163 | - | 256 | - |
| 80 | 72 | Liberty Coca-Cola Beverages |
611 | 225 | - | 755 | - |
| 81 | 75 | Coca-Cola Beverages Florida |
598 | 14 | - | 657 | - |
| 82 | 83 | Stericycle Inc. |
566 | 3,752 | - | 2,095 | $3.5 billion |
| 83 | - | Ecology Auto Parts |
565 | 13 | - | 679 | - |
| 84 | 88 | Mohawk Industries |
562 | 140 | - | 1,990 | $10.0 billion |
| 85 | 91 | Medline Inc. |
561 | 164 | - | 935 | $11.7 billion |
| 86 | 86 | H-E-B Grocery Co. |
530 | 4 | - | 2,355 | - |
| 87 | - | SpartanNash |
525 | 4 | - | 1,827 | $8.1 billion |
| 88 | - | Domino's Pizza |
517 | 39 | - | 506 | $3.4 billion |
| 89 | 58 | Bunzl Distribution USA |
502 | 25 | - | 746 | $6.6 billion |
| 90 | 97 | Sanderson Farms |
500 | 27 | - | 616 | $3.2 billion |
| 91 | 81 | C&S Wholesale Grocers |
490 | - | - | 4,543 | - |
| 92 | 90 | Valley Proteins |
488 | 136 | 55 | 1,311 | - |
| 93 | 98 | Nuverra Environmental Solutions |
479 | 45 | - | 424 | $0.2 billion |
| 94 | 89 | Ace Hardware Corp. |
477 | 1 | - | 1,537 | $5.7 billion |
| 95 | 98 | Bragg Cos. |
454 | - | - | 808 | - |
| 96 | - | Columbia Distributing |
450 | 154 | - | 635 | - |
| 97 | 93 | Herc Rentals |
448 | 300 | - | 447 | $2.0 billion |
| 98 | 94 | The H.T. Hackney Co. |
443 | 172 | - | 613 | - |
| 99 | 84 | Foster Farms |
440 | 20 | - | 2,500 | $2.4 billion |
| 100 | 96 | KeHE Distributors |
428 | - | - | 734 | $5.0 billion |
The Top 100 Private Carriers on this list operate their own trucks to carry freight and are ranked on the basis of the total number of highway tractors in the fleet. To be included in the Top 100 list, please send contact information to tteditor@ttnews.com. We will contact you via phone or e-mail to get information about your company prior to publication of the next Top 100 list.
On the Bubble
Hershey’s Main Owner Rejects Mondelez’s Offer as Too Low

The main owner of chocolate maker Hershey has rejected a preliminary takeover offer from Mondelez International Inc., people familiar with the matter said.
December 11, 2024Hershey Could Be More Open to Mondelez Takeover

Mondelez International’s latest overture to Hershey underscores the challenges posed by high cocoa prices and penny-pinching consumers, which could make the company more open to a deal.
December 11, 2024Albertsons Sues Kroger for Failing to Secure Merger

Albertsons is giving up on its merger with Kroger and it is suing the grocery chain, saying it didn’t do enough to secure regulatory approval for the $24.6 billion agreement.
Mondelez Approves $9 Billion Buyback After Hershey Report

Mondelez International approved a stock repurchase authorization of as much as $9 billion, days after a report that the company was exploring an acquisition of chocolate maker Hershey.
Kroger’s $24.6 Billion Albertsons Deal Blocked by Judge

A judge blocked Kroger's $24.6 billion acquisition of Albertsons Cos., finding the takeover would lessen competition for grocery shoppers in a ruling that marks a likely death knell for the deal.
Mondelez’s Takeover of Hershey Would Rank as Top 2024 Deal

Snack-food giant Mondelez International’s potential takeover of chocolate maker Hershey Co. would rank as the year’s top M&A deal.
Tally of US Shoppers Slipped During Thanksgiving Weekend

Fewer Americans shopped during Thanksgiving weekend this year, a sign that consumers remain selective about spending.
Tyson to Shut Kansas Plant as US Beef Shortage Erodes Profit

Tyson Foods will shut a meat plant in Kansas next year, eliminating 809 jobs, as the company seeks to slash costs amid a downturn in the beef industry.
Cargill to Cut Thousands of Jobs After Profits Shrink

Cargill Inc. is cutting thousands of jobs globally after the largest privately held company in the U.S. missed profit targets.
Quikrete Secures $9.2 Billion for Summit Materials Deal

The package is among the largest seen since 2022, when the Federal Reserve began lifting interest rates, ending the easy-money era.
-

2023
-
2022
-
2021
-
2020
-
2019
-
2018
-
2017
-
2016
-
2015
-
2014
-
2013
-
2012
-
2011
-
2010
-
2009
-
2008
-
2007
-
2006
-
2005
-
2004


