North America’s largest trucking companies continued growth in 2022 despite a weaker freight environment
Recruiting the truckers of tomorrow is a top priority for trucking companies preparing for years to come
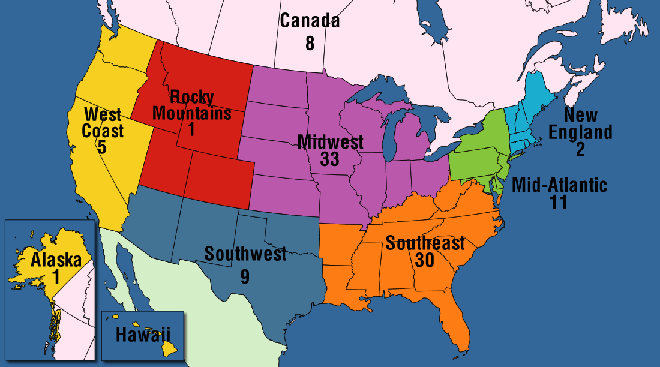
Find out where the Top 100 For-Hire carriers are located by region; click links to view details about the company
| Rank This Year | Rank Last Year | Company | Revenue (000) | Net Income (000) | Employees | Tractors* | Trailers |
|---|---|---|---|---|---|---|---|
| 1 | 1 | UPS Inc.
|
100,300,000 | 11,500,000 | 536,000 | 16,440 | 85,024 |
| 2 | 2 | FedEx Corp.
|
92,619,000 | 2,992,000 | 547,000 | 38,749 | 141,902 |
| 3 | 4 | J.B. Hunt Transport Services
|
14,814,000 | 969,351 | 37,000 | 20,215 | 43,040 |
| 4 | 5 | TFI International
|
8,813,000 | 823,000 | 25,836 | 18,347 | 38,091 |
| 5 | 3 | XPO
|
7,718,000 | 666,000 | 38,000 | 8,200 | 27,000 |
| 6 | 6 | Landstar System
|
7,437,000 | 430,914 | 1,449 | 11,281 | 18,593 |
| 7 | 7 | Knight-Swift Transportation Holdings
|
7,429,000 | 771,000 | 27,900 | 21,899 | 83,210 |
| 8 | 8 | Schneider
|
6,604,400 | 457,800 | 17,050 | 10,200 | 44,120 |
| 9 | 11 | Ryder System
|
6,506,000 | 288,000 | 48,000 | 69,400 | 41,500 |
| 10 | 9 | Old Dominion Freight Line
|
6,260,077 | 1,377,159 | 24,027 | 11,274 | 45,567 |
| 11 | 13 | Hub Group
|
5,340,000 | 357,000 | 5,900 | 3,050 | 4,600 |
| 12 | 14 | ArcBest
|
5,324,052 | 298,209 | 15,000 | 4,457 | 23,968 |
| 13 | 10 | Yellow Corp.
|
5,245,000 | 22,000 | 30,000 | 12,700 | 42,000 |
| 14 | 12 | Estes Express Lines
|
5,150,000 | - | 22,111 | 9,694 | 37,032 |
| 15 | 15 | Penske Logistics
|
4,400,000 | - | 20,743 | 8,242 | 22,375 |
| 16 | 16 | NFI
|
3,900,000 | - | 16,800 | 5,000 | 14,300 |
| 17 | 17 | Werner Enterprises
|
3,289,978 | 241,256 | 14,300 | 8,639 | 27,650 |
| 18 | 19 | R+L Carriers
|
2,864,000 est |
- | 6,774 | 19,709 | |
| 19 | 20 | Prime Inc.
|
2,813,522 | 450,972 | 4,685 | 8,575 | 17,472 |
| 20 | 18 | Purolator
|
2,800,000 | 338,000 | 13,222 | 529 | 1,070 |
| 21 | 21 | Saia Inc.
|
2,792,057 | 357,422 | 12,300 | 6,200 | 20,800 |
| 22 | 24 | Kenan Advantage Group
|
2,480,512 | - | 10,000 | 7,320 | 12,700 |
| 23 | 22 | Evans Delivery
|
2,425,000 est |
- | 650 | 9,000 | 3,000 |
| 24 | 23 | U.S. Xpress Enterprises
|
2,161,000 | -42,000 | 9,397 | 7,200 | 14,400 |
| 25 | 26 | Universal Logistics Holdings
|
2,015,456 | - | 10,000 | 4,260 | 3,945 |
| 26 | 25 | CRST The Transportation Solution
|
2,000,000 | - | 6,224 | 4,788 | |
| 27 | 27 | Forward Air
|
1,973,000 | 193,000 | 4,155 | 916 | 6,726 |
| 28 | 29 | C.R. England
|
1,837,665 | - | 6,500 | 3,996 | 5,544 |
| 29 | 32 | Averitt Express
|
1,834,641 | - | 9,309 | 5,255 | 15,774 |
| 30 | 30 | Anderson Trucking Service
|
1,794,300 | - | 2,413 | 2,631 | 6,941 |
| 31 | 31 | Daseke Inc. (TFI)
|
1,773,000 | 50,000 | 4,123 | 4,982 | 10,723 |
| 32 | 35 | Southeastern Freight Lines
|
1,741,123 | - | 8,694 | 3,075 | 8,440 |
| 33 | 36 | PS Logistics
|
1,710,000 | - | 3,600 | 3,950 | 6,400 |
| 34 | 38 | Ruan
|
1,680,306 | - | 5,500 | 3,792 | 10,566 |
| 35 | 27 | OnTrac Inc.
|
1,662,000 est |
- | |||
| 36 | 33 | UniGroup
|
1,600,000 | - | 795 | 150 | 5,237 |
| 37 | 52 | Mullen Group
|
1,536,895 | 121,906 | 4,459 | 2,167 | 6,333 |
| 38 | 37 | Crete Carrier Corp.
|
1,525,000 est |
- | 6,500 | 5,000 | 13,000 |
| 39 | 34 | Day & Ross
|
1,510,000 | - | 8,964 | 3,289 | 9,854 |
| 40 | 43 | IMC Logistics
|
1,397,609 | - | 2,797 | 1,890 | 150 |
| 41 | 39 | Lynden
|
1,300,000 | - | 2,519 | 1,088 | 3,348 |
| 42 | 47 | Marten Transport
|
1,263,878 | 110,354 | 4,575 | 3,660 | 5,753 |
| 43 | 42 | Bennett Family of Cos.
|
1,251,872 | - | 1,175 | 3,337 | 2,911 |
| 44 | 40 | Central Transport International
|
1,236,000 est |
- | 2,953 | 11,877 | |
| 45 | 64 | Hirschbach Motor Lines
|
1,219,000 | - | 2,624 | 3,152 | 5,250 |
| 46 | 40 | Covenant Logistics Group
|
1,216,858 | 108,682 | 4,985 | 2,368 | 5,074 |
| 47 | ITS Logistics
|
1,210,000 | 202,900 | 1,027 | 160 | 1,976 | |
| 48 | 48 | KLLM Transport Services
|
1,142,000 | - | 3,500 | 5,900 | |
| 49 | 53 | Bison Transport
|
1,109,156 | - | 4,406 | 2,577 | 9,300 |
| 50 | 45 | Western Express
|
1,107,974 | 145,023 | 5,300 | 3,550 | 9,200 |
| 51 | 44 | Cardinal Logistics
|
1,102,000 | - | 4,070 | 3,245 | 9,000 |
| 52 | 54 | AAA Cooper Transportation
|
1,069,554 | 142,500 | 5,500 | 3,261 | 8,200 |
| 53 | 46 | Atlas World Group
|
1,064,200 | 13,400 | 840 | 1,638 | 3,562 |
| 54 | 61 | R&R Family of Cos.
|
1,014,000 | - | 746 | 1,016 | 1,626 |
| 55 | 49 | 10 Roads Express
|
1,012,000 | - | 5,583 | 3,300 | 3,900 |
| 56 | 60 | Dayton Freight Lines
|
1,004,000 | - | 5,838 | 2,261 | 5,223 |
| 57 | 51 | Quality Carriers
|
984,000 est |
- | 1,600 | 2,600 | 7,500 |
| 58 | 66 | Heartland Express
|
968,000 | 137,000 | 4,710 | 5,946 | 18,551 |
| 59 | 72 | Fastfrate Group
|
950,000 est |
- | 3,000 | 2,702 | 5,019 |
| 60 | 50 | Pitt Ohio
|
948,670 | - | 5,315 | 1,611 | 4,131 |
| 61 | 58 | P.A.M. Transport
|
947,000 | 91,000 | 3,395 | 2,451 | 7,784 |
| 62 | 55 | Stevens Transport
|
910,000 | 184,500 | 3,350 | 2,275 | 3,850 |
| 63 | 57 | USA Truck
|
853,000 est |
25,000 | 2,069 | 2,157 | 6,548 |
| 64 | 56 | United Road Services
|
802,000 est |
- | 1,837 | 1,978 | 2,110 |
| 65 | 59 | Canada Cartage
|
774,000 | - | 3,500 | 2,519 | 3,402 |
| 66 | 63 | A. Duie Pyle
|
768,000 | - | 3,977 | 1,528 | 3,036 |
| 67 | RoadOne IntermodaLogistics
|
749,767 | - | 3,806 | 2,200 | 1,890 | |
| 68 | 62 | Cowan Systems
|
727,612 | - | 2,527 | 2,569 | 7,426 |
| 69 | 74 | Quantix Supply Chain Solutions
|
715,000 | - | 2,094 | 1,640 | 3,764 |
| 70 | 65 | Mercer Transportation
|
635,000 | - | 266 | 2,093 | 2,093 |
| 71 | 67 | Trimac Transportation
|
626,000 est |
- | 1,681 | 3,250 | |
| 72 | 73 | Mesilla Valley Transportation
|
622,328 | - | 2,897 | 1,756 | 6,311 |
| 73 | 70 | Roehl Transport
|
606,744 | - | 2,933 | 2,166 | 5,820 |
| 74 | 68 | Heniff Transportation Systems
|
596,000 est |
- | 1,806 | 5,066 | |
| 75 | 71 | Jack Cooper Holdings
|
579,000 | - | 2,000 | 1,286 | 1,284 |
| 76 | 75 | TMC Transportation
|
566,000 est |
- | 3,098 | 4,252 | |
| 77 | 69 | Two Men and a Truck Movers
|
525,000 est |
- | 11,396 | ||
| 78 | 93 | ContainerPort Group
|
510,000 | - | 450 | 1,500 | |
| 79 | 79 | Maverick USA
|
461,256 | - | 2,173 | 1,645 | 2,763 |
| 80 | 91 | Beemac Trucking
|
452,201 | - | 260 | 550 | 650 |
| 81 | 83 | Dependable Supply Chain Services
|
439,000 | - | 1,485 | 576 | 1,147 |
| 82 | 86 | Melton Truck Lines
|
438,305 | - | 1,698 | 1,456 | 2,281 |
| 83 | 76 | Foodliner/Quest Liner
|
437,035 | - | 1,684 | 1,621 | 3,125 |
| 84 | 85 | Koch Cos.
|
425,000 est |
- | 1,213 | 983 | 5,689 |
| 85 | 98 | PGT Holdings
|
404,080 | 18,789 | 596 | 1,096 | 1,719 |
| 86 | 84 | Dupré Logistics
|
393,000 | - | 1,225 | 675 | 1,400 |
| 87 | 80 | Daylight Transport
|
389,000 est |
- | |||
| 88 | 79 | Roadrunner Freight
|
386,000 est |
- | |||
| 89 | 81 | Dart Transit Co.
|
377,600 est |
- | 2,051 | 7,140 | |
| 90 | 82 | Red Classic
|
365,000 est |
- | 1,206 | 649 | 3,500 |
| 91 | 88 | Leonard's Express
|
360,848 | 3,583 | 930 | 616 | 1,089 |
| 92 | 90 | Trans-System
|
356,000 | - | 1,170 | 995 | 1,920 |
| 93 | 96 | Artur Express
|
340,886 | - | 509 | 757 | 3,400 |
| 94 | 94 | Oak Harbor Freight Lines
|
338,000 est |
- | 1,700 | 777 | 2,487 |
| 95 | 89 | Western Flyer Express
|
333,000 est |
- | 1,150 | 4,000 | |
| 96 | 92 | New Legend
|
328,129 | - | 1,300 | 1,200 | 4,600 |
| 97 | 95 | Transervice Logistics
|
316,800 | - | 1,200 | 1,897 | 5,487 |
| 98 | 100 | Paper Transport
|
301,328 | - | 1,260 | 900 | 3,200 |
| 99 | 97 | Paschall Truck Lines
|
265,000 est |
- | 1,545 | 1,170 | 3,500 |
| 100 | National Carriers
|
253,300 | - | 588 | 653 | 1,250 |
Top For-Hire Carriers on this list are common and contract freight carriers operating in the United States, Canada and Mexico. Companies are ranked on the basis of annual revenue. To be included in the Top 100 or any of the sectors, please send contact information to tteditor@ttnews.com. We will contact you via phone or e-mail to get information about your company prior to publication of the next Top 100 list.
* Tractor count includes company-owned, lease-to-own and owner-operator tractors.
#2 FedEx Corp. revenue and net income is for the 12-month period ended Feb. 28, 2023.
#7 Knight-Swift data does not reflect its planned acquisition of U.S. Xpress Enterprises, which the companies expected to close late in the second quarter or early in the third quarter.
#24 U.S. Xpress: In March, Knight-Swift announced plans to acquire U.S. Xpress Enterprises but the acquisition had not closed at press time.
#37 Mullen Group: Revenue and income converted to U.S. dollars from Canadian dollars based on average 2022 exchange rate.
#59 Fastfrate Group 2022 revenue and equipment counts are estimated by TT based on multiple data sources.
#77 Two Men and a Truck Movers revenue is for 2019.
#89 Dart Transit Co. revenue is estimated by SJ Consulting Group for 2020.
#90 Red Classic revenue is for 2021.
#99 Paschall Truck Lines revenue is for 2021.
#18 R+ L Carriers, #23 Evans Delivery, #35 OnTrac Inc., #38 Crete Carrier Corp., #44 Central Transport International, #57 Quality Carriers, #63 USA Truck, #64 United Road Services, #71 Trimac Transportation, #74 Heniff Transportation Systems, #76 TMC Transportation, #84 Koch Cos., #87 Daylight Transport, #88 Roadrunner Freight, #94 Oak Harbor Freight Lines, #95 Western Flyer Express revenue is estimated by SJ Consulting Group.
A top industry concern for years, suitable parking spaces remain elusive for many truckers
On the Bubble
The numerous, complex regulations faced by the trucking industry can be made simpler using new technology
If your company appears on the list, you have a few ways to announce it. Visit our logo library to get web- and print-ready graphics
While mergers and acquisitions alter the business landscape, top for-hire carriers grew revenues across segments in 2022
Learn more about how companies are selected for Transport Topics' Top 100 largest for-hire carriers list
Kenan Advantage Group Owner Omers Exploring IPO
Omers Private Equity is exploring an initial public offering of Kenan Advantage Group, one of North America’s biggest tank truck transporter and logistics providers, according to sources.
Roadrunner Opens Service Center in Atlanta
Roadrunner opened a new less-than-truckload service center in Atlanta, the longhaul freight carrier announced April 10.
Kodiak Forms Autonomous Truck Council With Walmart, UPS
Kodiak Robotics launched an advisory council to bolster its efforts to commercialize autonomous trucks with the help of trucking industry leaders, the company announced March 27.
Penske Sues Sacramento Over Environmental Plan
Penske Truck Leasing Co. has sued the city of Sacramento, Calif., alleging the city's environmental plan will harm the company's large North Sacramento facility.
UPS to Become the Primary Air Cargo Provider for USPS
UPS will become the primary air cargo provider for the United States Postal Service after FedEx said it wasn’t able to reach an agreement on mutually beneficial terms to extend its contract.
Work Continues on Establishing PC-12 Oil Category
PC-12 will replace the current API CK-4 and FA-4 engine oils, but there are still hurdles ahead of the finish line.
UPS Sees Sales, Profit Growth Coming Out of ‘Difficult’ 2023
UPS Inc. expects sales and profit to grow over the next three years as the courier overcomes soft demand for package delivery coming out of the pandemic.
Amazon Delivery Rival Pandion Secures Funding for Expansion
E-commerce logistics startup Pandion — which helps retailers like Saks Fifth Avenue compete with Amazon’s delivery — has secured $41.5 million in fresh funds to expand its operation.
FedEx Plans $5 Billion Buyback of Shares
FedEx Corp. plans to buy back $5 billion of its shares as cost-cutting efforts have helped boost the courier’s profits as fiscal third-quarter earnings beat expectations.
March 21, 2024Aerolane Seeks to Use Freighter Planes to Pull Cargo Gliders
Aerolane is testing a business plan to pull cargo gliders with small freighter planes.


