


| Rank This Year | Rank Last Year | Company | Revenue (000) | Net Income (000) | Employees | Tractors* | Trailers |
|---|---|---|---|---|---|---|---|
| 1 | 1 | UPS Inc.
|
71,861,000 | 4,791,000 | 481,000 | 19,732 | 106,481 |
| 2 | 2 | FedEx Corp.
|
69,200,000 | 3,636,000 | 425,000 | 29,813 | 113,218 |
| 3 | 3 | XPO
|
17,279,000 | 390,000 | 100,000 | 14,438 | 25,689 |
| 6 | 6 | Yellow Corp.
|
5,092,000 | 20,200 | 31,000 | 14,100 | 45,000 |
| 4 | 4 | J.B. Hunt Transport Services
|
8,614,874 | 489,585 | 28,300 | 15,808 | 33,510 |
| 9 | 11 | Old Dominion Freight Line
|
4,043,695 | 605,668 | 22,858 | 9,254 | 35,729 |
| 5 | 5 | Knight-Swift Transportation Holdings
|
5,344,066 | 456,070 | 22,800 | 19,156 | 69,544 |
| 7 | 7 | Schneider
|
4,977,000 | 268,900 | 19,400 | 13,700 | 37,800 |
| 16 | 19 | Penske Logistics
|
2,300,000 | - | 19,012 | 3,491 | 10,162 |
| 13 | 14 | Estes Express Lines
|
3,160,000 | - | 18,451 | 7,569 | 29,519 |
| 10 | 9 | TFI International
|
3,954,008 | 225,356 | 17,127 | 15,992 | 26,487 |
| 14 | 13 | ArcBest
|
3,093,788 | 67,262 | 13,000 | 4,273 | 22,680 |
| 15 | 15 | Werner Enterprises
|
2,457,914 | 168,148 | 12,852 | 7,860 | 25,255 |
| 19 | 17 | NFI
|
2,040,000 | - | 10,900 | 4,000 | 9,700 |
| 25 | 27 | Saia Inc.
|
1,653,849 | 104,981 | 10,300 | 4,834 | 15,483 |
| 36 | 28 | Purolator
|
1,078,043 | - | 10,000 | 465 | 1,329 |
| 32 | 32 | Averitt Express
|
1,298,463 | - | 9,000 | 4,947 | 15,182 |
| 27 | 24 | Kenan Advantage Group
|
1,536,191 | - | 9,000 | 6,409 | 10,732 |
| 30 | 30 | Southeastern Freight Lines
|
1,378,929 | - | 8,989 | 3,570 | 11,569 |
| 20 | 21 | U.S. Xpress Enterprises
|
1,842,817 | 26,106 | 8,912 | 6,909 | 16,000 |
| 26 | 25 | C.R. England
|
1,636,138 | - | 8,196 | 4,287 | 6,494 |
| 24 | 23 | CRST The Transportation Solution
|
1,685,000 | - | 7,131 | 6,052 | 14,077 |
| 28 | 31 | Universal Logistics Holdings
|
1,461,708 | 52,178 | 6,335 | 4,057 | 6,152 |
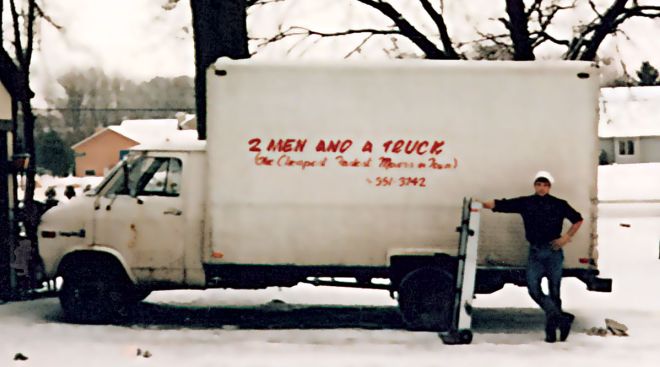
| 70 | 64 | Two Men and a Truck Movers
|
487,236 | - | 6,334 | ||
| 35 | 34 | Crete Carrier Corp.
|
1,156,000 | - | 6,000 | 5,373 | 13,430 |
| 21 | 29 | Daseke Inc.
|
1,770,000 | -5,187 | 5,930 | 6,144 | 13,824 |
| 43 | 46 | Pitt Ohio Transportation Group
|
826,947 | - | 5,751 | 2,047 | 5,534 |
| 39 | 41 | Ruan
|
957,131 | - | 5,700 | 3,700 | 9,600 |
| 38 | 35 | Celadon Group Inc.
|
999,700 | - | 5,500 | 3,850 | 10,000 |
| 42 | 47 | Covenant Logistics Group
|
885,455 | 42,503 | 5,500 | 3,154 | 6,950 |
| 31 | 32 | Forward Air
|
1,320,886 | 92,051 | 5,411 | 1,185 | 6,647 |
| 12 | 8 | Hub Group
|
3,683,593 | 201,740 | 5,400 | 3,800 | 5,000 |
| 50 | 50 | AAA Cooper Transportation
|
725,000 | - | 5,234 | 2,690 | 6,800 |
| 54 | 59 | Dayton Freight Lines
|
659,000 | 89,577 | 4,922 | 1,752 | 4,408 |
| 18 | 18 | Prime Inc.
|
2,186,057 | 306,419 | 4,900 | 7,226 | 13,524 |
| 17 | 16 | Roadrunner Freight
|
2,216,141 | -165,597 | 4,600 | 3,422 | 5,563 |
| 47 | 44 | Cardinal Logistics
|
800,000 | - | 4,220 | 2,560 | 8,000 |
| 53 | 52 | Mullen Group
|
674,027 | - | 3,759 | 1,978 | 5,055 |
| 60 | 54 | Jack Cooper Holdings
|
581,000 | - | 3,753 | 1,843 | 2,290 |
| 49 | 55 | PS Logistics
|
747,339 | - | 3,664 | 3,150 | 5,300 |
| 48 | 48 | Marten Transport
|
787,594 | 55,027 | 3,600 | 2,661 | 5,594 |
| 57 | 53 | Heartland Express
|
610,803 | 72,677 | 3,450 | 2,906 | 10,506 |
| 69 | 75 | Black Horse Carriers
|
491,000 | - | 3,438 | 1,700 | 4,000 |
| 46 | 45 | Day & Ross
|
806,806 | - | 3,277 | 2,872 | 9,006 |
| 52 | 58 | Western Express
|
695,122 | - | 3,250 | 2,805 | 7,600 |
| 66 | 56 | Trimac Transportation
|
528,672 | - | 3,165 | 1,966 | 4,080 |
| 67 | 61 | Canada Cartage System
|
501,659 | - | 3,160 | 3,309 | 2,817 |
| 62 | 65 | Bison Transport
|
556,684 | - | 3,100 | 1,697 | 5,096 |
| 75 | 79 | A. Duie Pyle Inc.
|
428,800 | - | 2,851 | 1,083 | 2,086 |
| 65 | 71 | P.A.M. Transport
|
533,261 | 23,994 | 2,748 | 2,031 | 6,397 |
| 51 | 49 | Stevens Transport
|
719,870 | 102,660 | 2,700 | 2,715 | 3,900 |
| 37 | 38 | Lynden
|
1,050,000 | - | 2,658 | 998 | 2,679 |
| 76 | 78 | Roehl Transport
|
421,330 | - | 2,460 | 1,966 | 4,902 |
| 64 | 69 | USA Truck (DB Schenker)
|
534,060 | 12,204 | 2,400 | 1,674 | 5,531 |
| 68 | 68 | Dart Transit Co.
|
491,912 | - | 2,362 | 2,068 | 7,408 |
| 59 | 60 | Suddath
|
600,000 | - | 2,200 | ||
| 97 | 94 | Martin Transportation Systems
|
282,483 | - | 2,179 | 1,261 | 2,592 |
| 77 | 80 | Maverick USA
|
395,771 | - | 2,156 | 1,632 | 2,446 |
| 33 | 36 | Anderson Trucking Service
|
1,244,459 | - | 2,143 | 2,636 | 6,978 |
| 63 | 66 | Cowan Systems
|
537,163 | - | 2,107 | 2,073 | 5,785 |
| 80 | 82 | IMC Cos.
|
368,560 | - | 2,001 | 1,455 | 148 |
| 94 | 100 | Acme Truck Line
|
290,475 | - | 2,000 | 900 | 1,000 |
| 95 | 96 | Challenger Motor Freight
|
285,000 | - | 1,875 | 1,530 | 3,350 |
| 54 | 51 | United Road Services
|
659,000 | - | 1,846 | 2,550 | 1,300 |
| 85 | 92 | Melton Truck Lines
|
302,227 | - | 1,701 | 1,359 | 2,276 |
| 79 | 72 | Mesilla Valley Transportation
|
383,950 | - | 1,662 | 1,400 | 5,000 |
| 8 | 10 | Landstar System
|
4,615,144 | 255,281 | 1,306 | 10,599 | 16,743 |
| 82 | 88 | Foodliner/Quest Liner
|
317,062 | - | 1,301 | 1,279 | 2,301 |
| 73 | 87 | Hirschbach Motor Lines
|
454,454 | - | 1,213 | 1,860 | 3,490 |
| 81 | Red Classic
|
354,416 | - | 1,211 | 546 | 2,647 | |
| 83 | 89 | Koch Cos.
|
310,000 | - | 1,167 | 1,155 | 5,432 |
| 91 | 85 | Cassens Transport Co.
|
292,635 | - | 1,126 | 1,150 | 1,150 |
| 56 | 62 | Bennett International Group
|
612,140 | - | 1,124 | 1,632 | 2,698 |
| 95 | 95 | Quantix Supply Chain Solutions
|
285,000 | - | 1,100 | 858 | 1,132 |
| 86 | 91 | Trans-System Inc.
|
300,000 | - | 1,100 | 1,000 | 1,870 |
| 98 | PGT Trucking
|
280,000 | - | 675 | 1,020 | 1,820 | |
| 41 | 40 | Atlas World Group
|
900,500 | 10,000 | 650 | 1,064 | 4,136 |
| 34 | 39 | Evans Delivery
|
1,163,625 | - | 429 | 6,000 | 550 |
| 86 | ContainerPort Group
|
300,000 | - | 400 | 1,400 | 100 | |
| 58 | 63 | Mercer Transportation Co.
|
602,504 | - | 305 | 2,608 | 2,608 |
| 89 | 99 | John Christner Trucking
|
295,171 | 24,907 | 207 | 801 | 1,103 |
| 78 | 81 | Transport Investments
|
384,719 | - | 200 | 1,035 | 1,899 |
| 29 | 26 | Sirva Inc.
|
1,400,000 | - | 1,657 | 2,867 | |
| 45 | 42 | Quality Carriers
|
822,000 | - | 2,541 | 5,204 | |
| 61 | 57 | OnTrac Inc.
|
562,856 | - | 23 | 900 | |
| 93 | Hansen & Adkins Auto Transport
|
290,935 | - | 1,137 | 1,139 | ||
| 99 | 98 | Superior Bulk Logistics
|
277,000 | - | 1,100 | 2,000 | |
| 84 | 86 | TransAm Trucking
|
307,000 | - | 1,135 | 1,823 | |
| 100 | 97 | United Vision Logistics
|
275,000 | - | 977 | 1,217 | |
| 22 | 19 | UniGroup
|
1,700,000 | - | 5,022 | 5,607 | |
| 23 | 22 | R+L Carriers
|
1,692,000 | - | 5,084 | 15,675 | |
| 71 | 67 | 10 Roads Express
|
480,806 | - | 1,857 | 2,281 | |
| 40 | 37 | KLLM Transport Services
|
917,000 | - | 3,500 | 5,400 | |
| 72 | 74 | TMC Transportation
|
464,000 | - | 2,752 | 3,691 | |
| 86 | RoadOne IntermodaLogistics
|
300,000 | - | 1,700 | 200 | ||
| 74 | 77 | LaserShip Inc./OnTrac Inc.
|
435,000 | - | 14 | 10 | |
| 90 | Heniff Transportation Systems
|
293,000 | - | 1,100 | 3,000 | ||
| 11 | 12 | Ryder Supply Chain Solutions
|
3,731,457 | 194,806 | |||
| 44 | 43 | Central Transport International
|
825,000 | - | 3,180 | 6,543 | |
| 92 | 90 | Dependable Supply Chain Services
|
291,000 | - | 346 | 1,113 |
Top For-Hire Carriers on this list are common and contract freight carriers operating in the United States, Canada and Mexico. Companies are ranked on the basis of annual revenue. To be included in the Top 100 or any of the sectors, please send contact information to tteditor@ttnews.com. We will contact you via phone or e-mail to get information about your company prior to publication of the next Top 100 list.
* Tractor count includes company-owned, lease-to-own and owner-operator tractors.

On the Bubble


ArcBest Reports $1 Billion Revenue for Q1
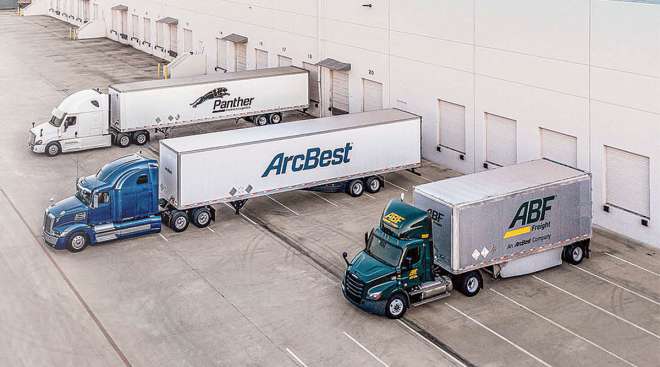
ArcBest saw its bottom line swing from a profit to a loss and posted a decline in revenue during Q1 on the heels of market softness and weather-related delays, the company reported.
Ryder Continues Cross-Border Expansion With New Facility
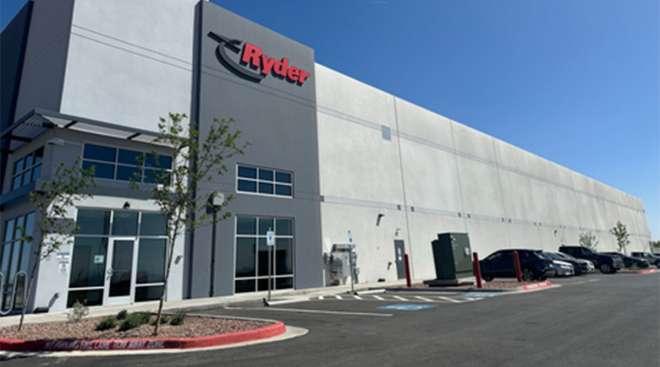
Ryder System is opening a second multiclient logistics facility at a U.S.-Mexico port to take advantage of the recent nearshoring trend, the company announced April 29.
Logistics Supply Chain Shows Steadiness Amid Rough Waters
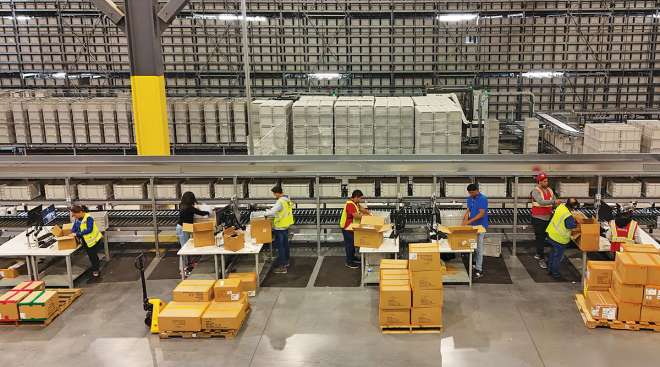
During the past four years, supply chain and logistics companies have ridden the highs and lows of a market that included a pandemic and fractured economy to keep goods moving.
TFI Profit Falls 17.1% on ‘Worse Than Expected’ Market

Profits at TFI International fell 17.1% year-over-year in the first quarter of 2024 on the back of what CEO Alain Bédard said was a particularly weak freight environment.
Intermodal Chassis Manufacturers Pull Back on Output
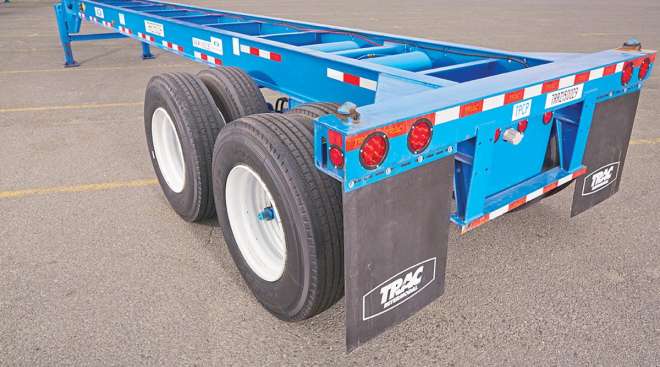
Intermodal chassis manufacturers are scaling back production as a result of weak demand as well as a supply overhang, company executives said.
Top 100 For-Hire Carriers: How to Get on the List

Find out how your trucking business stacks up by submitting data for the 2024 Transport Topics Top 100 For-Hire Carriers publication.
April 25, 2024Knight-Swift Reports Earnings Drop Amid Revenue Growth
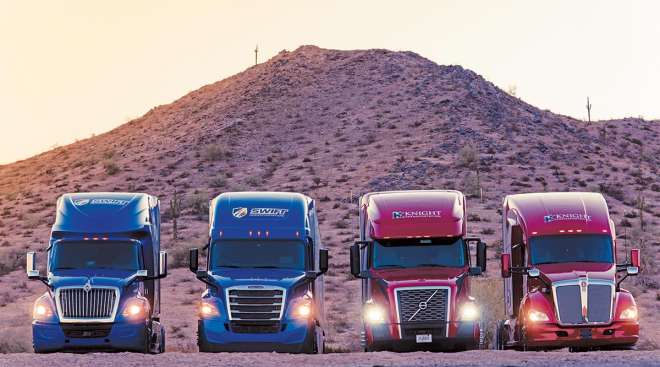
Knight-Swift Transportation Holdings saw its first-quarter bottom-line results swing from a profit to a loss.
Mullen Group Reports Lower Revenue for Q1
Mullen Group experienced a decrease in revenue and earnings during the first quarter of 2024, the company reported April 25.
Forward Air Hires Ex-Ceva Logistics Executive Stewart as CEO
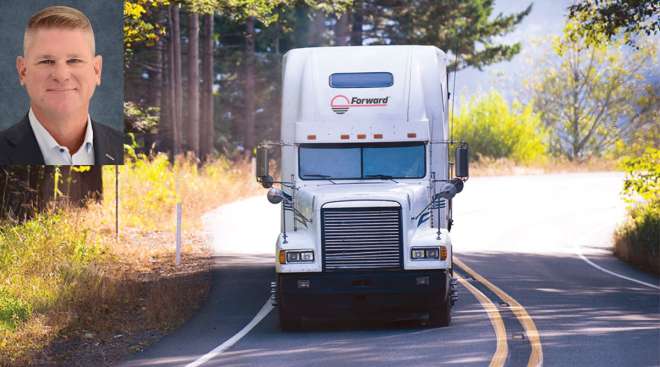
Shawn Stewart is set to join Forward Air as CEO, effective April 28, the carrier said April 23. He also will join the asset-light transportation services group’s board of directors.
ODFL Reports Q1 Revenue and Earnings Growth
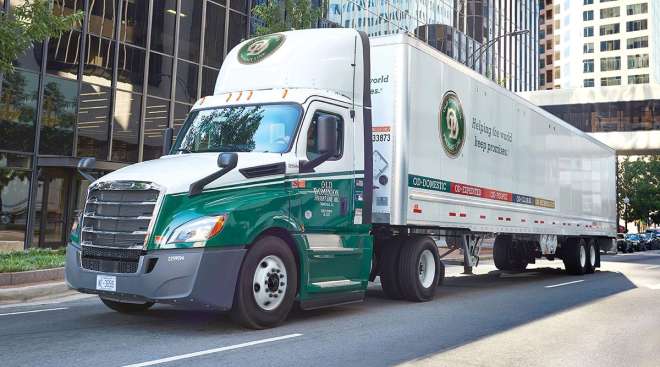
Old Dominion Freight Line experienced growth in revenue and earnings for the first quarter of 2024, the company reported April 24.
-

2022
-
2021
-
2020
-
2019
-
2018
-
2017
-
2016
-
2015
-
2014
-
2013
-
2012
-
2011
-
2010
-
2009
-
2008
-
2007
-
2006
-
2005
-
2004


