


| Rank This Year | Rank Last Year | Company | Revenue (000) | Net Income (000) | Employees | Tractors* | Trailers |
|---|---|---|---|---|---|---|---|
| 1 | 1 | UPS Inc.
|
71,861,000 | 4,791,000 | 481,000 | 19,732 | 106,481 |
| 2 | 2 | FedEx Corp.
|
69,200,000 | 3,636,000 | 425,000 | 29,813 | 113,218 |
| 4 | 4 | J.B. Hunt Transport Services
|
8,614,874 | 489,585 | 28,300 | 15,808 | 33,510 |
| 6 | 6 | Yellow Corp.
|
5,092,000 | 20,200 | 31,000 | 14,100 | 45,000 |
| 7 | 7 | Schneider
|
4,977,000 | 268,900 | 19,400 | 13,700 | 37,800 |
| 12 | 8 | Hub Group
|
3,683,593 | 201,740 | 5,400 | 3,800 | 5,000 |
| 10 | 9 | TFI International
|
3,954,008 | 225,356 | 17,127 | 15,992 | 26,487 |
| 8 | 10 | Landstar System
|
4,615,144 | 255,281 | 1,306 | 10,599 | 16,743 |
| 9 | 11 | Old Dominion Freight Line
|
4,043,695 | 605,668 | 22,858 | 9,254 | 35,729 |
| 14 | 13 | ArcBest
|
3,093,788 | 67,262 | 13,000 | 4,273 | 22,680 |
| 3 | 3 | XPO
|
17,279,000 | 390,000 | 100,000 | 14,438 | 25,689 |
| 13 | 14 | Estes Express Lines
|
3,160,000 | - | 18,451 | 7,569 | 29,519 |
| 15 | 15 | Werner Enterprises
|
2,457,914 | 168,148 | 12,852 | 7,860 | 25,255 |
| 17 | 16 | Roadrunner Freight
|
2,216,141 | -165,597 | 4,600 | 3,422 | 5,563 |
| 20 | 21 | U.S. Xpress Enterprises
|
1,842,817 | 26,106 | 8,912 | 6,909 | 16,000 |
| 22 | 19 | UniGroup
|
1,700,000 | - | 5,022 | 5,607 | |
| 27 | 24 | Kenan Advantage Group
|
1,536,191 | - | 9,000 | 6,409 | 10,732 |
| 18 | 18 | Prime Inc.
|
2,186,057 | 306,419 | 4,900 | 7,226 | 13,524 |
| 36 | 28 | Purolator
|
1,078,043 | - | 10,000 | 465 | 1,329 |
| 26 | 25 | C.R. England
|
1,636,138 | - | 8,196 | 4,287 | 6,494 |
| 29 | 26 | Sirva Inc.
|
1,400,000 | - | 1,657 | 2,867 | |
| 24 | 23 | CRST The Transportation Solution
|
1,685,000 | - | 7,131 | 6,052 | 14,077 |
| 25 | 27 | Saia Inc.
|
1,653,849 | 104,981 | 10,300 | 4,834 | 15,483 |
| 28 | 31 | Universal Logistics Holdings
|
1,461,708 | 52,178 | 6,335 | 4,057 | 6,152 |
| 30 | 30 | Southeastern Freight Lines
|
1,378,929 | - | 8,989 | 3,570 | 11,569 |
| 16 | 19 | Penske Logistics
|
2,300,000 | - | 19,012 | 3,491 | 10,162 |
| 19 | 17 | NFI
|
2,040,000 | - | 10,900 | 4,000 | 9,700 |
| 5 | 5 | Knight-Swift Transportation Holdings
|
5,344,066 | 456,070 | 22,800 | 19,156 | 69,544 |
| 35 | 34 | Crete Carrier Corp.
|
1,156,000 | - | 6,000 | 5,373 | 13,430 |
| 31 | 32 | Forward Air
|
1,320,886 | 92,051 | 5,411 | 1,185 | 6,647 |
| 37 | 38 | Lynden
|
1,050,000 | - | 2,658 | 998 | 2,679 |
| 45 | 42 | Quality Carriers
|
822,000 | - | 2,541 | 5,204 | |
| 41 | 40 | Atlas World Group
|
900,500 | 10,000 | 650 | 1,064 | 4,136 |
| 33 | 36 | Anderson Trucking Service
|
1,244,459 | - | 2,143 | 2,636 | 6,978 |
| 57 | 53 | Heartland Express
|
610,803 | 72,677 | 3,450 | 2,906 | 10,506 |
| 40 | 37 | KLLM Transport Services
|
917,000 | - | 3,500 | 5,400 | |
| 39 | 41 | Ruan
|
957,131 | - | 5,700 | 3,700 | 9,600 |
| 38 | 35 | Celadon Group Inc.
|
999,700 | - | 5,500 | 3,850 | 10,000 |
| 60 | 54 | Jack Cooper Holdings
|
581,000 | - | 3,753 | 1,843 | 2,290 |
| 46 | 45 | Day & Ross
|
806,806 | - | 3,277 | 2,872 | 9,006 |
| 66 | 56 | Trimac Transportation
|
528,672 | - | 3,165 | 1,966 | 4,080 |
| 42 | 47 | Covenant Logistics Group
|
885,455 | 42,503 | 5,500 | 3,154 | 6,950 |
| 51 | 49 | Stevens Transport
|
719,870 | 102,660 | 2,700 | 2,715 | 3,900 |
| 48 | 48 | Marten Transport
|
787,594 | 55,027 | 3,600 | 2,661 | 5,594 |
| 21 | 29 | Daseke Inc.
|
1,770,000 | -5,187 | 5,930 | 6,144 | 13,824 |
| 50 | 50 | AAA Cooper Transportation
|
725,000 | - | 5,234 | 2,690 | 6,800 |
| 43 | 46 | Pitt Ohio Transportation Group
|
826,947 | - | 5,751 | 2,047 | 5,534 |
| 58 | 63 | Mercer Transportation Co.
|
602,504 | - | 305 | 2,608 | 2,608 |
| 52 | 58 | Western Express
|
695,122 | - | 3,250 | 2,805 | 7,600 |
| 54 | 51 | United Road Services
|
659,000 | - | 1,846 | 2,550 | 1,300 |
| 67 | 61 | Canada Cartage System
|
501,659 | - | 3,160 | 3,309 | 2,817 |
| 53 | 52 | Mullen Group
|
674,027 | - | 3,759 | 1,978 | 5,055 |
| 59 | 60 | Suddath
|
600,000 | - | 2,200 | ||
| 62 | 65 | Bison Transport
|
556,684 | - | 3,100 | 1,697 | 5,096 |
| 94 | 100 | Acme Truck Line
|
290,475 | - | 2,000 | 900 | 1,000 |
| 56 | 62 | Bennett International Group
|
612,140 | - | 1,124 | 1,632 | 2,698 |
| 54 | 59 | Dayton Freight Lines
|
659,000 | 89,577 | 4,922 | 1,752 | 4,408 |
| 68 | 68 | Dart Transit Co.
|
491,912 | - | 2,362 | 2,068 | 7,408 |
| 63 | 66 | Cowan Systems
|
537,163 | - | 2,107 | 2,073 | 5,785 |
| 65 | 71 | P.A.M. Transport
|
533,261 | 23,994 | 2,748 | 2,031 | 6,397 |
| 34 | 39 | Evans Delivery
|
1,163,625 | - | 429 | 6,000 | 550 |
| 76 | 78 | Roehl Transport
|
421,330 | - | 2,460 | 1,966 | 4,902 |
| 79 | 72 | Mesilla Valley Transportation
|
383,950 | - | 1,662 | 1,400 | 5,000 |
| 91 | 85 | Cassens Transport Co.
|
292,635 | - | 1,126 | 1,150 | 1,150 |
| 75 | 79 | A. Duie Pyle Inc.
|
428,800 | - | 2,851 | 1,083 | 2,086 |
| 77 | 80 | Maverick USA
|
395,771 | - | 2,156 | 1,632 | 2,446 |
| 95 | 96 | Challenger Motor Freight
|
285,000 | - | 1,875 | 1,530 | 3,350 |
| 83 | 89 | Koch Cos.
|
310,000 | - | 1,167 | 1,155 | 5,432 |
| 92 | 90 | Dependable Supply Chain Services
|
291,000 | - | 346 | 1,113 | |
| 89 | 99 | John Christner Trucking
|
295,171 | 24,907 | 207 | 801 | 1,103 |
| 86 | 91 | Trans-System Inc.
|
300,000 | - | 1,100 | 1,000 | 1,870 |
| 99 | 98 | Superior Bulk Logistics
|
277,000 | - | 1,100 | 2,000 | |
| 82 | 88 | Foodliner/Quest Liner
|
317,062 | - | 1,301 | 1,279 | 2,301 |
| 78 | 81 | Transport Investments
|
384,719 | - | 200 | 1,035 | 1,899 |
| 85 | 92 | Melton Truck Lines
|
302,227 | - | 1,701 | 1,359 | 2,276 |
| 80 | 82 | IMC Cos.
|
368,560 | - | 2,001 | 1,455 | 148 |
| 95 | 95 | Quantix Supply Chain Solutions
|
285,000 | - | 1,100 | 858 | 1,132 |
| 97 | 94 | Martin Transportation Systems
|
282,483 | - | 2,179 | 1,261 | 2,592 |
| 44 | 43 | Central Transport International
|
825,000 | - | 3,180 | 6,543 | |
| 86 | RoadOne IntermodaLogistics
|
300,000 | - | 1,700 | 200 | ||
| 47 | 44 | Cardinal Logistics
|
800,000 | - | 4,220 | 2,560 | 8,000 |
| 61 | 57 | OnTrac Inc.
|
562,856 | - | 23 | 900 | |
| 74 | 77 | LaserShip Inc./OnTrac Inc.
|
435,000 | - | 14 | 10 | |
| 98 | PGT Trucking
|
280,000 | - | 675 | 1,020 | 1,820 | |
| 49 | 55 | PS Logistics
|
747,339 | - | 3,664 | 3,150 | 5,300 |
| 71 | 67 | 10 Roads Express
|
480,806 | - | 1,857 | 2,281 | |
| 11 | 12 | Ryder Supply Chain Solutions
|
3,731,457 | 194,806 | |||
| 23 | 22 | R+L Carriers
|
1,692,000 | - | 5,084 | 15,675 | |
| 84 | 86 | TransAm Trucking
|
307,000 | - | 1,135 | 1,823 | |
| 64 | 69 | USA Truck (DB Schenker)
|
534,060 | 12,204 | 2,400 | 1,674 | 5,531 |
| 69 | 75 | Black Horse Carriers
|
491,000 | - | 3,438 | 1,700 | 4,000 |
| 73 | 87 | Hirschbach Motor Lines
|
454,454 | - | 1,213 | 1,860 | 3,490 |
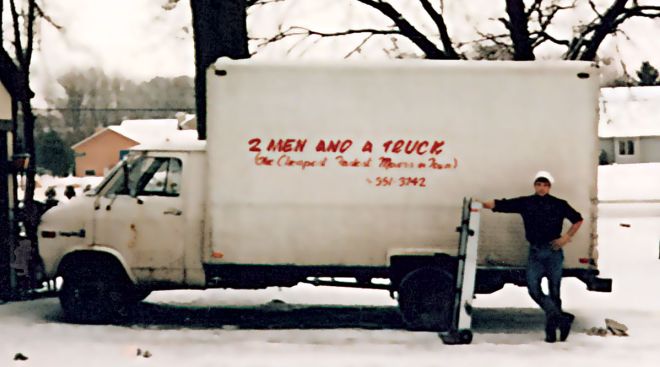
| 70 | 64 | Two Men and a Truck Movers
|
487,236 | - | 6,334 | ||
| 100 | 97 | United Vision Logistics
|
275,000 | - | 977 | 1,217 | |
| 32 | 32 | Averitt Express
|
1,298,463 | - | 9,000 | 4,947 | 15,182 |
| 72 | 74 | TMC Transportation
|
464,000 | - | 2,752 | 3,691 | |
| 86 | ContainerPort Group
|
300,000 | - | 400 | 1,400 | 100 | |
| 93 | Hansen & Adkins Auto Transport
|
290,935 | - | 1,137 | 1,139 | ||
| 81 | Red Classic
|
354,416 | - | 1,211 | 546 | 2,647 | |
| 90 | Heniff Transportation Systems
|
293,000 | - | 1,100 | 3,000 |
Top For-Hire Carriers on this list are common and contract freight carriers operating in the United States, Canada and Mexico. Companies are ranked on the basis of annual revenue. To be included in the Top 100 or any of the sectors, please send contact information to tteditor@ttnews.com. We will contact you via phone or e-mail to get information about your company prior to publication of the next Top 100 list.
* Tractor count includes company-owned, lease-to-own and owner-operator tractors.

On the Bubble


Ryder Opens Third E-Commerce Distribution Center in Columbus Market
Ryder System Inc. opened its third multiclient omnichannel distribution center in Columbus, Ohio, the company announced April 25.
Penske Truck Leasing Expands in Washington State
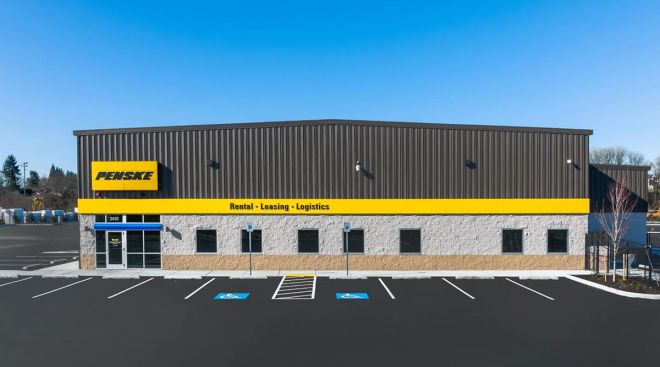
Penske Truck Leasing announced it opened a new facility in Everett, Wash., that offers consumer and commercial truck rental, full-service truck leasing and contract truck fleet maintenance.
April 22, 2022Mullen Reports Q1 Revenue, Profit Growth
Mullen Group Ltd. reported double-digit increases in profit and revenue for the first quarter but warned that the motor carrier was concerned about surging inflation and higher fuel expenses.
Landstar Reports Record Revenue, Earnings for Q1
Landstar System Inc. saw revenue and earnings reach a new record during the first quarter, the company reported April 20.
Knight-Swift Reports $1.8 Billion Revenue for Q1
Knight-Swift Transportation Holdings Inc. posted revenue and earnings growth during the first quarter, the company reported April 20.
J.B. Hunt Reports Jump in Revenue for Q1
J.B. Hunt Transport Services Inc. experienced a 33% increase in revenue year-over-year for the first quarter of 2022, the company reported April 18.
XPO to Open LTL Terminals in California, Georgia
XPO Logistics Inc. will expand its less-than-truckload network with the openings of two terminals, the company announced April 18.
April 18, 2022Amazon, UPS’ Biggest Customer, Is Also Its Biggest Competitive Threat
Amazon delivered more than 5 billion packages in the U.S. in 2021, while UPS delivered roughly 5.5 billion U.S. packages, according to company figures and industry estimates. Amazon has said it could surpass UPS this year, and it’s not alone in that prediction.
Diesel Falls 7.1¢ to $5.073 a Gallon

The national average price of diesel shed 7.1 cents to $5.073 a gallon, according to Energy Information Administration data released April 11.
Roehl Raises Pay With New Driver Compensation Plan
Roehl Transport has made a change to its driver pay plans that will allow driving teammates to make 12% to 14% more, the company announced April 6.
April 11, 2022-

2022
-
2021
-
2020
-
2019
-
2018
-
2017
-
2016
-
2015
-
2014
-
2013
-
2012
-
2011
-
2010
-
2009
-
2008
-
2007
-
2006
-
2005
-
2004


