


| Rank This Year | Rank Last Year | Company | Tractors | Trucks | Pickups/ Cargo Vans | Trailers | Annual Revenue |
|---|---|---|---|---|---|---|---|
| 1 | 1 | PepsiCo Inc. |
8,397 | 14,906 | - | 11,734 | $66.7 billion |
| 2 | 2 | Sysco Corp. |
7,647 | 1,190 | 388 | 9,577 | $46.5 billion |
| 3 | 4 | Wal-Mart Stores |
6,294 | 106 | - | 61,528 | $482.2 billion |
| 4 | 3 | Coca-Cola |
5,664 | 1,054 | - | 7,465 | $46.0 billion |
| 5 | 6 | Halliburton |
5,637 | 1,160 | - | 5,637 | $29.4 billion |
| 6 | 5 | U.S. Foods |
5,190 | 333 | - | 6,461 | $22.0 billion |
| 7 | 8 | Agrium Inc. |
3,806 | 2,479 | 7,627 | 5,937 | $13.0 billion |
| 8 | 9 | Reyes Holdings |
3,647 | 587 | 442 | 4,618 | $24.0 billion |
| 9 | 7 | McLane Co. |
3,537 | 305 | 9 | 5,283 | $46.0 billion |
| 10 | 11 | Schlumberger Limited |
3,394 | 1,299 | - | 4,770 | $48.6 billion |
| 11 | 10 | C & J Energy Services |
2,970 | 1,661 | - | 4,517 | $1.6 billion |
| 12 | 12 | Tyson Foods |
2,785 | - | 1,119 | 3,700 | $37.6 billion |
| 13 | 14 | Performance Food Group |
2,534 | 96 | - | 3,122 | - |
| 14 | 25 | CHS Inc. |
2,496 | 1,001 | - | 2,193 | $42.7 billion |
| 15 | 13 | Dr Pepper Snapple Group |
2,342 | 81 | 1,330 | 2,828 | $6.1 billion |
| 16 | 15 | Baker Hughes Inc. |
2,282 | 1,813 | - | 2,856 | $24.6 billion |
| 17 | 23 | Clean Harbors Inc. |
1,906 | 6,739 | - | 4,188 | $3.4 billion |
| 18 | 16 | Dean Foods Co. |
1,900 | 3,000 | 445 | 5,500 | $9.5 billion |
| 19 | 24 | Gordon Food Service |
1,700 | 88 | - | 2,158 | - |
| 20 | 20 | Weatherford International |
1,684 | 1,046 | - | 3,379 | $14.9 billion |
| 21 | 18 | Basic Energy Services |
1,620 | 386 | - | 1,819 | $1.5 billion |
| 22 | 22 | The Kroger Co. |
1,474 | 35 | - | 5,386 | $108.5 billion |
| 23 | 17 | United Rentals Inc. |
1,420 | 2,204 | - | 1,484 | $5.7 billion |
| 24 | 21 | Airgas Inc. |
1,410 | 2,781 | 1,236 | 3,857 | $5.1 billion |
| 25 | 19 | Gibson Energy Inc. |
1,400 | - | - | 2,600 | $8.6 billion |
| 26 | 33 | Albertsons |
1,378 | 621 | 88 | 5,225 | - |
| 27 | 44 | Key Energy Services |
1,355 | 1,897 | - | 1,500 | $1.4 billion |
| 28 | 38 | Helena Chemical Co. |
1,204 | 1,735 | - | 2,575 | - |
| 29 | 29 | Dot Foods |
1,190 | 2 | 16 | 1,835 | - |
| 30 | 27 | Praxair Inc. |
1,099 | 1,877 | - | 3,677 | $12.3 billion |
| 31 | 28 | Prairie Farms Dairy |
1,094 | 1,348 | 250 | 2,946 | - |
| 32 | 39 | Pilot Flying J Inc. |
1,035 | - | - | 1,331 | - |
| 33 | 30 | Cemex USA |
1,028 | 5,141 | - | 1,677 | $3.7 billion |
| 34 | 33 | Plains All American Pipeline |
990 | - | - | 1,900 | $43.5 billion |
| 35 | Builders FirstSource |
968 | 2,506 | - | 1,693 | $1.6 billion |
|
| 36 | 32 | Nestle USA |
936 | 4,216 | - | 1,313 | $9.7 billion |
| 37 | 31 | Veritiv Corp. |
870 | 199 | 172 | 1,290 | $7.4 billion |
| 38 | 49 | Sunbelt Rentals |
840 | 2,285 | - | 831 | $2.7 billion |
| 39 | 36 | Ben E. Keith Co. |
825 | 52 | - | 1,053 | - |
| 40 | 35 | Air Products Inc. |
811 | 115 | 400 | 2,100 | $10.4 billion |
| 41 | 41 | Darling Ingredients Inc. |
810 | 705 | 336 | 4,050 | $4.0 billion |
| 42 | 43 | Shaw Industries Group |
755 | 51 | 172 | 3,332 | $4.8 billion |
| 43 | 37 | Walgreen Co. |
754 | 10 | - | 1,848 | $76.4 billion |
| 44 | 26 | Calfrac Well Services |
744 | 378 | 9 | 914 | $2.3 billion |
| 45 | 52 | Linde North America |
733 | 1,840 | - | 2,060 | $2.0 billion |
| 46 | 40 | Kellogg Co. |
710 | 60 | - | 1,153 | $14.6 billion |
| 47 | 46 | Univar Inc. |
699 | 74 | - | 1,346 | - |
| 48 | 50 | Delhaize America |
684 | - | - | 3,253 | - |
| 48 | 73 | Perdue Farms Inc. |
684 | 79 | 600 | 2,100 | - |
| 50 | 45 | Lowe's Cos. Inc. |
662 | 3,844 | - | 681 | $56.2 billion |
| 51 | 42 | Nuverra Environmental Solutions |
653 | 417 | - | 1,012 | $0.5 billion |
| 52 | 53 | United Natural Foods Inc. |
652 | - | - | 835 | $6.8 billion |
| 53 | 54 | Ashley Furniture Industries |
646 | 7 | - | 2,300 | - |
| 54 | 58 | Cole-Mark Holding Co. |
639 | 64 | - | 794 | $10.3 billion |
| 55 | 61 | Advanced Drainage Systems |
625 | - | - | 1,100 | $1.2 billion |
| 56 | 50 | Mondelez International Inc. |
610 | 300 | 49 | 730 | $34.2 billion |
| 57 | 56 | Publix Super Markets |
605 | 30 | 401 | 2,909 | $30.6 billion |
| 58 | 70 | Love's Travel Stops $amp;amp; Country Stores |
600 | - | 20 | 620 | - |
| 59 | 48 | JBS USA Holdings |
599 | - | - | 1,290 | - |
| 60 | 64 | Food Services of America |
597 | 52 | - | 741 | - |
| 61 | 60 | ABC Supply Co. |
585 | 2,033 | 190 | 818 | - |
| 62 | 55 | Golden State Foods |
573 | 42 | - | 858 | $6.5 billion |
| 63 | 59 | Archer Daniels Midland Co. |
561 | 84 | - | 1,510 | $81.2 billion |
| 64 | Maxim Crane Works |
556 | - | - | 910 | - | |
| 65 | Quikrete Cos. |
554 | 23 | - | 929 | - | |
| 66 | Sanjel Corp. |
547 | - | - | - | - | |
| 67 | Pilot Thomas Logistics |
542 | 826 | - | 870 | - | |
| 68 | C&S Wholesale Grocers |
541 | - | - | 1,434 | $25.9 billion |
|
| 69 | 61 | MDU Resources Group |
539 | 1,873 | - | 1,915 | $4.5 billion |
| 70 | 63 | American Air Liquide Holdings |
529 | 57 | - | 1,244 | - |
| 71 | 65 | Bunzl Distribution USA |
520 | 24 | 8 | 835 | - |
| 72 | Cudd Energy Services |
514 | 260 | - | 956 | $2.3 billion |
|
| 73 | Energy Transfer Partners |
508 | 108 | - | 543 | $51.2 billion |
|
| 74 | 66 | H.E.B. Grocery Co. |
505 | 9 | - | 2,840 | - |
| 74 | 71 | Oldcastle Inc. |
505 | 1,732 | - | 1,509 | - |
| 76 | 79 | Shamrock Foods Co. |
504 | 60 | 75 | 757 | - |
| 77 | Veolia North America |
489 | 1,546 | - | 1,231 | - | |
| 78 | 75 | Pepsi Bottling Ventures |
466 | 147 | 202 | 530 | - |
| 79 | 82 | Ace Hardware Corp. |
450 | - | - | 1,126 | $4.7 billion |
| 80 | 67 | Foster Farms |
449 | 136 | - | 1,089 | - |
| 80 | SE Independent Delivery Services |
449 | 150 | - | 1,126 | - | |
| 82 | 84 | Sentinel Transportation |
439 | 55 | 41 | 1,168 | - |
| 83 | 81 | Bimbo Bakeries USA |
437 | 4,135 | - | 1,365 | - |
| 83 | 71 | Supervalu Inc. |
437 | 4 | - | 1,807 | $17.8 billion |
| 83 | 85 | The H.T. Hackney Co. |
437 | 172 | - | 593 | - |
| 86 | 77 | Sherwin-Williams Co. |
436 | 1 | - | 1,447 | $11.1 billion |
| 87 | Coca-Cola Bottling Co. United |
426 | 231 | - | 465 | - | |
| 88 | 74 | Mohawk Industries |
420 | 138 | - | 2,217 | $7.8 billion |
| 89 | 77 | Sanderson Farms Inc. |
408 | 31 | - | 575 | $2.8 billion |
| 90 | 68 | Patterson-UTI Energy Co. |
407 | 432 | - | 605 | $3.2 billion |
| 91 | 69 | BlueLinx Holdings |
401 | 6 | - | 615 | $2.0 billion |
| 92 | Hertz Equipment Rental |
397 | 745 | - | 431 | $1.6 billion |
|
| 93 | 94 | Valley Proteins Inc. |
380 | 107 | 30 | 1,033 | - |
| 94 | KeHE Distributors |
375 | - | - | 575 | - | |
| 95 | 87 | Castellini Co. |
373 | - | - | 530 | - |
| 96 | Ecolab Inc. |
371 | 576 | - | 369 | $14.0 billion |
|
| 96 | 83 | Maines Paper & Food Service |
371 | 62 | - | 501 | $4.0 billion |
| 98 | 90 | AmeriGas Partners |
370 | 8,775 | - | 1,040 | $3.7 billion |
| 98 | 86 | J.R. Simplot Co. |
370 | 793 | - | 1,444 | - |
| 100 | 90 | Nexeo Solutions |
369 | 3 | - | 643 | $4.5 billion |
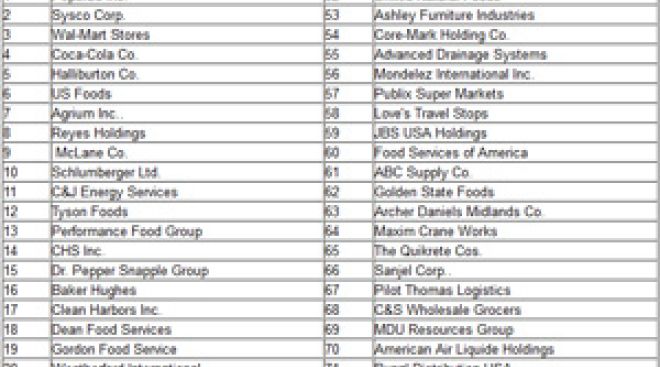
The Top 100 Private Carriers Companies on this list operate their own trucks to carry freight and are ranked on the basis of the total number of highway tractors in the fleet. To be included in the Top 100 list, please send contact information to tteditor@ttnews.com. We will contact you via phone or e-mail to get information about your company prior to publication of the next Top 100 list.

On the Bubble
Amazon Starts Same-Day Deliveries From Stores in Metro Areas
Amazon.com Inc. has started delivering items from brick-and-mortar stores in a dozen metro areas, the e-commerce giant’s latest effort to make more products available for speedy delivery.
Amazon Reports Strong Sales That Ease Fears of Slowdown
Amazon .com Inc. reported revenue that topped estimates and gave a strong sales forecast for the current quarter, allaying investor concerns about potential belt-tightening by inflation-rattled consumers. Shares jumped more than 10% in extended trading.
Walmart Cuts Full-Year Profit Outlook
Walmart Inc. cut its annual profit outlook for the second time this year, citing the need to lower prices to clear out bloated inventories.
Walmart Canada Adds 60-Foot Multizone Refrigerated Trailer
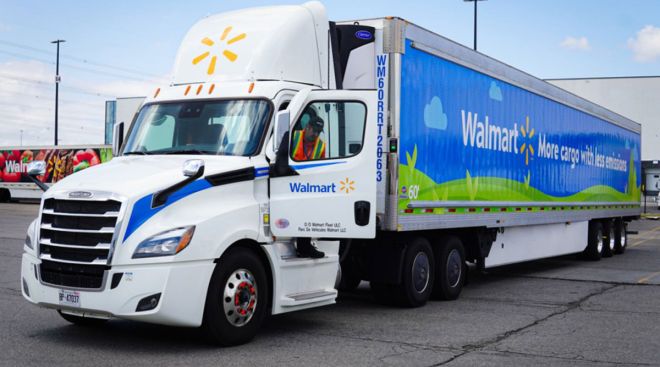
Walmart Canada has expanded its fleet to include for the first time in North America a 60-foot multitemperature-zone refrigerated trailer, built by Utility Trailer Manufacturing Co.
PepsiCo Boosts Outlook After Increasing Prices
PepsiCo Inc. is winning the inflation battle so far, successfully passing on surging commodity costs by persuading consumers to pay more for their soda and chips.
Amazon Prime Day Comes Amid Slowdown in Online Sales Growth
Amazon is heading into its annual Prime Day sales event today much differently from how it entered the pandemic.
Walmart Expands Program That Delivers Right to Your Fridge
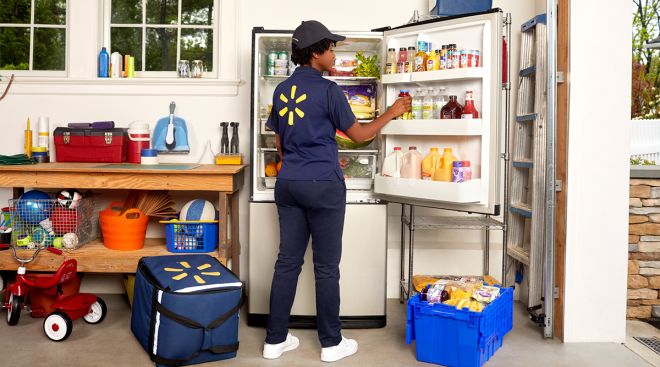
Walmart can now drop off groceries right into customers’ refrigerators via its InHome delivery service in several large metropolitan areas, the retailer announced July 6.
Amazon Will Take Stake in Grubhub, Offer Prime Users Membership
Just Eat Takeaway.com NV’s shares jumped the most in almost four years after Amazon.com Inc. agreed to take a stake in its Grubhub business.
Walmart Announces New Charges for Suppliers
Walmart Inc. is hitting some suppliers with two new charges as it struggles to soften the blow of surging transportation costs.
Amazon Names New Head for Troubled Retail Business
Amazon CEO Andy Jassy on June 21 named a new head for the company’s troubled retail business, which is dealing with a glut of warehouse space after a massive expansion during the pandemic.
June 21, 2022-

2022
-
2021
-
2020
-
2019
-
2018
-
2017
-
2016
-
2015
-
2014
-
2013
-
2012
-
2011
-
2010
-
2009
-
2008
-
2007
-
2006
-
2005
-
2004


