


| Rank This Year | Rank Last Year | Company | Revenue (000) | Net Income (000) | Employees | Tractors* | Trailers |
|---|---|---|---|---|---|---|---|
| 37 | 38 | Lynden
|
1,050,000 | - | 2,658 | 998 | 2,679 |
| 53 | 52 | Mullen Group
|
674,027 | - | 3,759 | 1,978 | 5,055 |
| 69 | 75 | Black Horse Carriers
|
491,000 | - | 3,438 | 1,700 | 4,000 |
| 85 | 92 | Melton Truck Lines
|
302,227 | - | 1,701 | 1,359 | 2,276 |
| 22 | 19 | UniGroup
|
1,700,000 | - | 5,022 | 5,607 | |
| 38 | 35 | Celadon Group Inc.
|
999,700 | - | 5,500 | 3,850 | 10,000 |
| 54 | 51 | United Road Services
|
659,000 | - | 1,846 | 2,550 | 1,300 |
| 70 | 64 | Two Men and a Truck Movers
|
487,236 | - | 6,334 | ||
| 86 | 91 | Trans-System Inc.
|
300,000 | - | 1,100 | 1,000 | 1,870 |
| 23 | 22 | R+L Carriers
|
1,692,000 | - | 5,084 | 15,675 | |
| 39 | 41 | Ruan
|
957,131 | - | 5,700 | 3,700 | 9,600 |
| 71 | 67 | 10 Roads Express
|
480,806 | - | 1,857 | 2,281 | |
| 86 | ContainerPort Group
|
300,000 | - | 400 | 1,400 | 100 | |
| 24 | 23 | CRST The Transportation Solution
|
1,685,000 | - | 7,131 | 6,052 | 14,077 |
| 40 | 37 | KLLM Transport Services
|
917,000 | - | 3,500 | 5,400 | |
| 56 | 62 | Bennett International Group
|
612,140 | - | 1,124 | 1,632 | 2,698 |
| 72 | 74 | TMC Transportation
|
464,000 | - | 2,752 | 3,691 | |
| 86 | RoadOne IntermodaLogistics
|
300,000 | - | 1,700 | 200 | ||
| 73 | 87 | Hirschbach Motor Lines
|
454,454 | - | 1,213 | 1,860 | 3,490 |
| 26 | 25 | C.R. England
|
1,636,138 | - | 8,196 | 4,287 | 6,494 |
| 58 | 63 | Mercer Transportation Co.
|
602,504 | - | 305 | 2,608 | 2,608 |
| 74 | 77 | LaserShip Inc./OnTrac Inc.
|
435,000 | - | 14 | 10 | |
| 90 | Heniff Transportation Systems
|
293,000 | - | 1,100 | 3,000 | ||
| 27 | 24 | Kenan Advantage Group
|
1,536,191 | - | 9,000 | 6,409 | 10,732 |
| 43 | 46 | Pitt Ohio Transportation Group
|
826,947 | - | 5,751 | 2,047 | 5,534 |
| 59 | 60 | Suddath
|
600,000 | - | 2,200 | ||
| 75 | 79 | A. Duie Pyle Inc.
|
428,800 | - | 2,851 | 1,083 | 2,086 |
| 91 | 85 | Cassens Transport Co.
|
292,635 | - | 1,126 | 1,150 | 1,150 |
| 44 | 43 | Central Transport International
|
825,000 | - | 3,180 | 6,543 | |
| 60 | 54 | Jack Cooper Holdings
|
581,000 | - | 3,753 | 1,843 | 2,290 |
| 76 | 78 | Roehl Transport
|
421,330 | - | 2,460 | 1,966 | 4,902 |
| 92 | 90 | Dependable Supply Chain Services
|
291,000 | - | 346 | 1,113 | |
| 13 | 14 | Estes Express Lines
|
3,160,000 | - | 18,451 | 7,569 | 29,519 |
| 29 | 26 | Sirva Inc.
|
1,400,000 | - | 1,657 | 2,867 | |
| 45 | 42 | Quality Carriers
|
822,000 | - | 2,541 | 5,204 | |
| 61 | 57 | OnTrac Inc.
|
562,856 | - | 23 | 900 | |
| 77 | 80 | Maverick USA
|
395,771 | - | 2,156 | 1,632 | 2,446 |
| 93 | Hansen & Adkins Auto Transport
|
290,935 | - | 1,137 | 1,139 | ||
| 30 | 30 | Southeastern Freight Lines
|
1,378,929 | - | 8,989 | 3,570 | 11,569 |
| 46 | 45 | Day & Ross
|
806,806 | - | 3,277 | 2,872 | 9,006 |
| 62 | 65 | Bison Transport
|
556,684 | - | 3,100 | 1,697 | 5,096 |
| 78 | 81 | Transport Investments
|
384,719 | - | 200 | 1,035 | 1,899 |
| 94 | 100 | Acme Truck Line
|
290,475 | - | 2,000 | 900 | 1,000 |
| 47 | 44 | Cardinal Logistics
|
800,000 | - | 4,220 | 2,560 | 8,000 |
| 63 | 66 | Cowan Systems
|
537,163 | - | 2,107 | 2,073 | 5,785 |
| 79 | 72 | Mesilla Valley Transportation
|
383,950 | - | 1,662 | 1,400 | 5,000 |
| 95 | 95 | Quantix Supply Chain Solutions
|
285,000 | - | 1,100 | 858 | 1,132 |
| 16 | 19 | Penske Logistics
|
2,300,000 | - | 19,012 | 3,491 | 10,162 |
| 32 | 32 | Averitt Express
|
1,298,463 | - | 9,000 | 4,947 | 15,182 |
| 80 | 82 | IMC Cos.
|
368,560 | - | 2,001 | 1,455 | 148 |
| 95 | 96 | Challenger Motor Freight
|
285,000 | - | 1,875 | 1,530 | 3,350 |
| 33 | 36 | Anderson Trucking Service
|
1,244,459 | - | 2,143 | 2,636 | 6,978 |
| 49 | 55 | PS Logistics
|
747,339 | - | 3,664 | 3,150 | 5,300 |
| 81 | Red Classic
|
354,416 | - | 1,211 | 546 | 2,647 | |
| 97 | 94 | Martin Transportation Systems
|
282,483 | - | 2,179 | 1,261 | 2,592 |
| 34 | 39 | Evans Delivery
|
1,163,625 | - | 429 | 6,000 | 550 |
| 50 | 50 | AAA Cooper Transportation
|
725,000 | - | 5,234 | 2,690 | 6,800 |
| 66 | 56 | Trimac Transportation
|
528,672 | - | 3,165 | 1,966 | 4,080 |
| 82 | 88 | Foodliner/Quest Liner
|
317,062 | - | 1,301 | 1,279 | 2,301 |
| 98 | PGT Trucking
|
280,000 | - | 675 | 1,020 | 1,820 | |
| 19 | 17 | NFI
|
2,040,000 | - | 10,900 | 4,000 | 9,700 |
| 35 | 34 | Crete Carrier Corp.
|
1,156,000 | - | 6,000 | 5,373 | 13,430 |
| 67 | 61 | Canada Cartage System
|
501,659 | - | 3,160 | 3,309 | 2,817 |
| 83 | 89 | Koch Cos.
|
310,000 | - | 1,167 | 1,155 | 5,432 |
| 99 | 98 | Superior Bulk Logistics
|
277,000 | - | 1,100 | 2,000 | |
| 36 | 28 | Purolator
|
1,078,043 | - | 10,000 | 465 | 1,329 |
| 52 | 58 | Western Express
|
695,122 | - | 3,250 | 2,805 | 7,600 |
| 68 | 68 | Dart Transit Co.
|
491,912 | - | 2,362 | 2,068 | 7,408 |
| 84 | 86 | TransAm Trucking
|
307,000 | - | 1,135 | 1,823 | |
| 100 | 97 | United Vision Logistics
|
275,000 | - | 977 | 1,217 | |
| 17 | 16 | Roadrunner Freight
|
2,216,141 | -165,597 | 4,600 | 3,422 | 5,563 |
| 21 | 29 | Daseke Inc.
|
1,770,000 | -5,187 | 5,930 | 6,144 | 13,824 |
| 41 | 40 | Atlas World Group
|
900,500 | 10,000 | 650 | 1,064 | 4,136 |
| 64 | 69 | USA Truck (DB Schenker)
|
534,060 | 12,204 | 2,400 | 1,674 | 5,531 |
| 6 | 6 | Yellow Corp.
|
5,092,000 | 20,200 | 31,000 | 14,100 | 45,000 |
| 65 | 71 | P.A.M. Transport
|
533,261 | 23,994 | 2,748 | 2,031 | 6,397 |
| 89 | 99 | John Christner Trucking
|
295,171 | 24,907 | 207 | 801 | 1,103 |
| 20 | 21 | U.S. Xpress Enterprises
|
1,842,817 | 26,106 | 8,912 | 6,909 | 16,000 |
| 42 | 47 | Covenant Logistics Group
|
885,455 | 42,503 | 5,500 | 3,154 | 6,950 |
| 28 | 31 | Universal Logistics Holdings
|
1,461,708 | 52,178 | 6,335 | 4,057 | 6,152 |
| 48 | 48 | Marten Transport
|
787,594 | 55,027 | 3,600 | 2,661 | 5,594 |
| 14 | 13 | ArcBest
|
3,093,788 | 67,262 | 13,000 | 4,273 | 22,680 |
| 57 | 53 | Heartland Express
|
610,803 | 72,677 | 3,450 | 2,906 | 10,506 |
| 54 | 59 | Dayton Freight Lines
|
659,000 | 89,577 | 4,922 | 1,752 | 4,408 |
| 31 | 32 | Forward Air
|
1,320,886 | 92,051 | 5,411 | 1,185 | 6,647 |
| 51 | 49 | Stevens Transport
|
719,870 | 102,660 | 2,700 | 2,715 | 3,900 |
| 25 | 27 | Saia Inc.
|
1,653,849 | 104,981 | 10,300 | 4,834 | 15,483 |
| 15 | 15 | Werner Enterprises
|
2,457,914 | 168,148 | 12,852 | 7,860 | 25,255 |
| 11 | 12 | Ryder Supply Chain Solutions
|
3,731,457 | 194,806 | |||
| 12 | 8 | Hub Group
|
3,683,593 | 201,740 | 5,400 | 3,800 | 5,000 |
| 10 | 9 | TFI International
|
3,954,008 | 225,356 | 17,127 | 15,992 | 26,487 |
| 8 | 10 | Landstar System
|
4,615,144 | 255,281 | 1,306 | 10,599 | 16,743 |
| 7 | 7 | Schneider
|
4,977,000 | 268,900 | 19,400 | 13,700 | 37,800 |
| 18 | 18 | Prime Inc.
|
2,186,057 | 306,419 | 4,900 | 7,226 | 13,524 |
| 3 | 3 | XPO
|
17,279,000 | 390,000 | 100,000 | 14,438 | 25,689 |
| 5 | 5 | Knight-Swift Transportation Holdings
|
5,344,066 | 456,070 | 22,800 | 19,156 | 69,544 |
| 4 | 4 | J.B. Hunt Transport Services
|
8,614,874 | 489,585 | 28,300 | 15,808 | 33,510 |
| 9 | 11 | Old Dominion Freight Line
|
4,043,695 | 605,668 | 22,858 | 9,254 | 35,729 |
| 2 | 2 | FedEx Corp.
|
69,200,000 | 3,636,000 | 425,000 | 29,813 | 113,218 |
| 1 | 1 | UPS Inc.
|
71,861,000 | 4,791,000 | 481,000 | 19,732 | 106,481 |
Top For-Hire Carriers on this list are common and contract freight carriers operating in the United States, Canada and Mexico. Companies are ranked on the basis of annual revenue. To be included in the Top 100 or any of the sectors, please send contact information to tteditor@ttnews.com. We will contact you via phone or e-mail to get information about your company prior to publication of the next Top 100 list.
* Tractor count includes company-owned, lease-to-own and owner-operator tractors.

On the Bubble


Social Media Platforms Open Fleets to Newer Recruiting Pool

Fleets are looking more to social media platforms to increase brand awareness, reach new customers and, increasingly, find new employees.
Knight-Swift Adds 10 More Leased Yellow Terminals to Haul
Knight-Swift Transportation Holdings Inc. extended its winning streak in auctions of former Yellow Corp. terminals, strengthening its less-than-truckload operations.
Ryder Q4 Profit Slides on Weak Used Truck Prices, Rentals
Profits at Ryder System Inc. fell 39.8% in the fourth quarter of 2023 as weak freight conditions again sapped strength from used vehicle sales prices and rental activity, it said Feb. 14.
XPO Looks to Lower Leverage, May Buy Back Debt Early, CFO Says
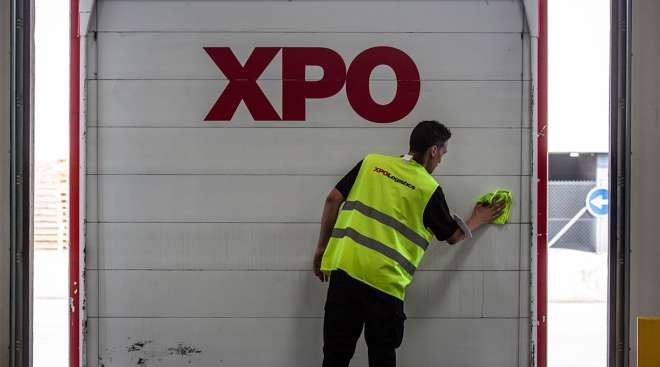
Less-than-truckload carrier XPO Inc. is working to reduce its leverage after it purchased assets from Yellow Corp. and might consider buying back some of its debt at par, its finance chief said.
TFI Eyes Merger for Truckload Operations as Part of Spinoff

TFI International’s truckload operations could be merged with a competitor to divide the Montreal-based company into two publicly traded entities, likely in 2025, its CEO said Feb. 9.
TFI Q4 Profits Fall 14.4% as Deals Dull Freight Market Toll
Profits at TFI International in the fourth quarter fell 14.4% compared with the same period a year earlier, as acquisitions softened the impact of a weak freight environment.
Forward Air CEO Tom Schmitt Exits After Omni Deal Completion

Forward Air CEO Tom Schmitt exited the company days after finally completing the carrier’s at-times contentious merger with Omni Logistics.
Trucking Executives Cite Opportunities for AI Adoption
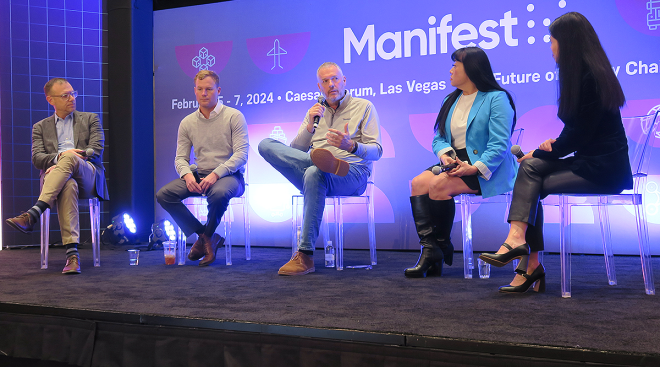
LAS VEGAS — Artificial intelligence promises to unlock greater efficiency in the freight transportation industry, but implementing AI functions is not without its challenges.
ArcBest Reports 31% Earnings Gain Despite Revenue Drop
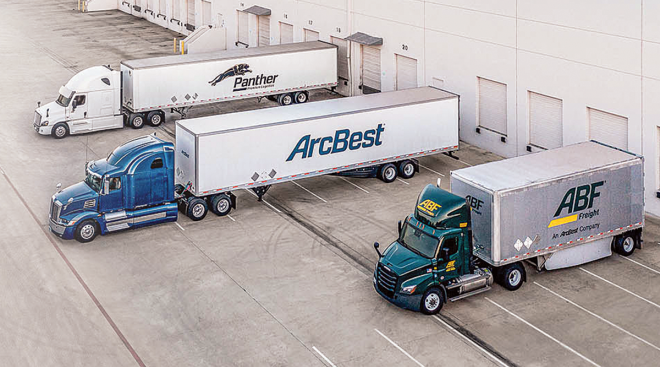
ArcBest Corp. experienced a 30.7% increase in earnings despite a decline in revenue during the fourth quarter of 2023, the company reported Feb. 6.
Auto Stoppages Push P.A.M. Transportation Into Red in Q4
Labor stoppages at automotive manufacturers across the U.S. and a weak freight environment hit profits at carrier P.A.M. Transportation in the final three months of 2023, the company said.
-

2022
-
2021
-
2020
-
2019
-
2018
-
2017
-
2016
-
2015
-
2014
-
2013
-
2012
-
2011
-
2010
-
2009
-
2008
-
2007
-
2006
-
2005
-
2004


