


| Rank This Year | Rank Last Year | Company | Revenue (000) | Net Income (000) | Employees | Tractors* | Trailers |
|---|---|---|---|---|---|---|---|
| 1 | 1 | UPS Inc.
|
65,872,000 | 4,910,000 | 454,000 | 18,683 | 97,746 |
| 2 | 2 | FedEx Corp.
|
63,864,000 | 4,465,000 | 425,000 | 29,873 | 113,218 |
| 3 | 3 | XPO
|
15,380,800 | 312,400 | 95,000 | 16,287 | 27,591 |
| 6 | 5 | Yellow Corp.
|
4,891,000 | -10,800 | 32,000 | 14,100 | 44,600 |
| 4 | 4 | J.B. Hunt Transport Services
|
7,189,568 | 385,308 | 27,670 | 14,392 | 32,931 |
| 5 | 30 | Knight-Swift Transportation Holdings
|
5,136,261 | 529,922 | 25,400 | 23,069 | 74,949 |
| 11 | 11 | Old Dominion Freight Line
|
3,358,112 | 463,774 | 20,944 | 8,316 | 32,890 |
| 7 | 6 | Schneider
|
4,383,600 | 389,900 | 19,600 | 11,859 | 37,637 |
| 19 | 21 | Penske Logistics
|
1,700,000 | - | 18,011 | 2,935 | 9,108 |
| 14 | 14 | Estes Express Lines
|
2,740,000 | - | 17,397 | 6,695 | 27,443 |
| 9 | 10 | TFI International
|
3,906,575 | 130,181 | 17,044 | 16,132 | 24,617 |
| 13 | 12 | ArcBest
|
2,826,457 | 59,726 | 13,000 | 4,436 | 22,275 |
| 15 | 16 | Werner Enterprises
|
2,116,737 | 92,000 | 12,154 | 7,480 | 24,500 |
| 17 | 27 | NFI
|
1,910,000 | - | 10,000 | 4,000 | 8,900 |
| 28 | 20 | Purolator
|
1,343,111 | - | 10,000 | 465 | 1,329 |
| 27 | 28 | Saia Inc.
|
1,378,510 | 91,156 | 9,800 | 4,259 | 13,901 |
| 21 | 21 | U.S. Xpress Enterprises
|
1,600,000 | - | 9,522 | 6,600 | 16,800 |
| 24 | 25 | Kenan Advantage Group
|
1,441,440 | - | 9,000 | 6,686 | 10,744 |
| 30 | 29 | Southeastern Freight Lines
|
1,260,050 | - | 8,792 | 3,635 | 11,697 |
| 32 | 31 | Averitt Express
|
1,146,970 | 98,967 | 8,500 | 4,513 | 14,585 |
| 31 | 32 | Universal Logistics Holdings
|
1,216,665 | 28,153 | 8,231 | 3,784 | 5,765 |
| 25 | 26 | C.R. England
|
1,405,411 | - | 7,975 | 4,213 | 6,116 |
| 23 | 19 | CRST The Transportation Solution
|
1,555,000 | - | 7,538 | 5,774 | 12,145 |
| 64 | Two Men and a Truck Movers
|
487,236 | - | 6,136 | |||
| 34 | 35 | Crete Carrier Corp.
|
1,100,000 | - | 6,000 | 5,400 | 14,000 |
| 41 | 40 | Ruan
|
836,298 | - | 5,500 | 2,900 | 8,710 |
| 46 | 50 | Pitt Ohio Transportation Group
|
715,827 | - | 5,381 | 1,856 | 5,372 |
| 35 | 33 | Celadon Group Inc.
|
1,065,356 | - | 5,200 | 3,850 | 10,000 |
| 50 | 53 | AAA Cooper Transportation
|
665,000 | - | 5,000 | 3,000 | 6,500 |
| 33 | 37 | Forward Air
|
1,100,816 | 87,321 | 4,898 | 964 | 6,464 |
| 29 | 42 | Daseke Inc.
|
1,300,000 | 26,996 | 4,700 | 5,200 | 11,500 |
| 16 | 15 | Roadrunner Freight
|
2,091,300 | -91,200 | 4,600 | 3,625 | 6,920 |
| 59 | 60 | Dayton Freight Lines
|
562,000 | - | 4,501 | 1,561 | 3,803 |
| 8 | 9 | Hub Group
|
4,034,897 | 135,153 | 4,377 | 3,520 | 5,850 |
| 18 | 18 | Prime Inc.
|
1,875,031 | 208,184 | 4,300 | 6,296 | 12,753 |
| 47 | 47 | Covenant Logistics Group
|
705,007 | 55,439 | 4,297 | 2,700 | 7,389 |
| 44 | 36 | Cardinal Logistics
|
720,000 | - | 4,245 | 2,905 | 7,940 |
| 53 | 52 | Heartland Express
|
607,336 | 75,173 | 3,800 | 6,719 | 19,975 |
| 54 | 48 | Jack Cooper Holdings
|
602,825 | 74,839 | 3,753 | 2,637 | |
| 70 | 66 | Shevell Group
|
439,500 | - | 3,745 | 1,550 | 3,950 |
| 52 | 58 | Mullen Group
|
627,372 | - | 3,535 | 1,919 | 5,065 |
| 48 | 46 | Marten Transport
|
698,120 | 90,284 | 3,492 | 2,738 | 4,909 |
| 56 | 45 | Trimac Transportation
|
576,796 | - | 3,200 | 1,720 | 3,800 |
| 75 | 79 | Black Horse Carriers
|
412,500 | - | 3,150 | 1,670 | 3,500 |
| 61 | 62 | Canada Cartage System
|
546,309 | - | 3,137 | 2,548 | 2,817 |
| 55 | 61 | PS Logistics
|
595,780 | - | 3,000 | 2,500 | |
| 65 | 74 | Bison Transport
|
472,004 | - | 2,944 | 1,704 | 4,732 |
| 49 | 49 | Stevens Transport
|
694,980 | 83,845 | 2,925 | 2,810 | 4,010 |
| 58 | 55 | Western Express
|
566,230 | 41,998 | 2,850 | 2,555 | 7,800 |
| 79 | 78 | A. Duie Pyle Inc.
|
373,000 | - | 2,697 | 946 | 1,936 |
| 68 | 64 | Dart Transit Co.
|
451,925 | - | 2,626 | 2,131 | 7,159 |
| 73 | 71 | TransX Group of Companies
|
415,541 | - | 2,617 | 1,365 | 4,410 |
| 38 | 39 | Lynden
|
950,000 | - | 2,600 | 768 | 2,889 |
| 71 | 68 | P.A.M. Transport
|
437,838 | 38,899 | 2,409 | 2,281 | 5,795 |
| 69 | 70 | USA Truck (DB Schenker)
|
446,533 | 7,497 | 2,400 | 1,669 | 5,596 |
| 78 | 76 | Roehl Transport
|
384,473 | - | 2,336 | 1,983 | 4,873 |
| 82 | 84 | IMC Cos.
|
332,490 | - | 2,300 | 1,658 | 148 |
| 45 | 51 | Day & Ross
|
718,941 | - | 2,240 | 1,800 | 5,714 |
| 80 | 80 | Maverick USA
|
352,068 | - | 2,122 | 1,648 | 2,480 |
| 36 | 34 | Anderson Trucking Service
|
1,004,301 | - | 1,996 | 2,652 | 6,958 |
| 66 | 67 | Cowan Systems
|
462,544 | - | 1,946 | 2,122 | 5,677 |
| 100 | Acme Truck Line
|
239,000 | - | 1,900 | 1,315 | 1,314 | |
| 96 | 89 | Challenger Motor Freight
|
258,734 | - | 1,850 | 1,469 | 3,300 |
| 72 | 72 | Mesilla Valley Transportation
|
430,261 | - | 1,760 | 1,450 | 6,000 |
| 94 | 97 | Martin Transportation Systems
|
261,403 | - | 1,725 | 1,060 | 2,250 |
| 51 | 56 | United Road Services
|
645,000 | - | 1,700 | 1,850 | 1,150 |
| 92 | Melton Truck Lines
|
269,785 | - | 1,569 | 1,310 | 2,111 | |
| 98 | 99 | Superior Bulk Logistics
|
252,300 | 14,500 | 1,370 | 1,100 | 2,000 |
| 10 | 9 | Landstar System
|
3,646,364 | 177,088 | 1,273 | 9,438 | 15,534 |
| 85 | 83 | Cassens Transport Co.
|
302,004 | - | 1,265 | 1,231 | 1,231 |
| 88 | 91 | Foodliner/Quest Liner
|
277,471 | - | 1,190 | 1,183 | 2,233 |
| 89 | 85 | Koch Cos.
|
277,000 | - | 1,190 | 1,053 | 5,476 |
| 95 | 100 | Quantix Supply Chain Solutions
|
259,370 | - | 1,100 | 858 | 1,132 |
| 91 | 90 | Trans-System Inc.
|
271,000 | - | 1,050 | 1,000 | 1,700 |
| 62 | 69 | Bennett International Group
|
512,874 | - | 1,023 | 1,345 | 2,126 |
| 87 | 92 | Hirschbach Motor Lines
|
278,494 | - | 800 | 1,250 | 1,965 |
| 40 | 41 | Atlas World Group
|
842,100 | 4,800 | 671 | 1,271 | 4,076 |
| 39 | 59 | Evans Delivery
|
898,000 | - | 376 | 5,014 | 550 |
| 63 | 63 | Mercer Transportation Co.
|
492,509 | - | 293 | 2,299 | 2,299 |
| 99 | 96 | John Christner Trucking
|
244,696 | 13,138 | 222 | 809 | 1,112 |
| 81 | 87 | Transport Investments
|
339,920 | - | 190 | 1,037 | 1,846 |
| 77 | LaserShip Inc./OnTrac Inc.
|
400,000 | - | 29 | 27 | ||
| 93 | 77 | Central Freight Lines
|
266,000 | - | 2,001 | 8,012 | |
| 97 | 93 | United Vision Logistics
|
256,000 | - | 1,003 | 1,347 | |
| 67 | 10 Roads Express
|
452,429 | - | 1,935 | 2,421 | ||
| 83 | 82 | Dicom Transportation Group
|
320,700 | - | |||
| 19 | 17 | UniGroup
|
1,700,000 | - | |||
| 84 | 94 | Salmon Cos.
|
314,303 | - | 713 | 1,092 | |
| 37 | 38 | KLLM Transport Services
|
959,000 | - | 3,800 | 5,700 | |
| 22 | 24 | R+L Carriers
|
1,580,000 | - | 5,084 | 15,675 | |
| 86 | 88 | TransAm Trucking
|
280,000 | - | 1,135 | 1,823 | |
| 57 | 56 | OnTrac Inc.
|
572,856 | - | 36 | 950 | |
| 26 | 21 | Sirva Inc.
|
1,400,000 | - | |||
| 42 | 43 | Quality Carriers
|
786,000 | - | 2,541 | 5,204 | |
| 74 | 73 | TMC Transportation
|
413,000 | - | 2,613 | 3,404 | |
| 90 | 86 | Dependable Supply Chain Services
|
274,000 | - | 344 | 1,220 | |
| 43 | 44 | Central Transport International
|
754,000 | - | 3,180 | 6,543 | |
| 12 | 13 | Ryder Supply Chain Solutions
|
3,065,500 | 158,400 | |||
| 60 | 54 | Suddath
|
550,000 | - | |||
| 76 | 81 | Epes Carriers Inc.
|
400,977 | 26,309 | 1,272 | 6,065 |
Top For-Hire Carriers on this list are common and contract freight carriers operating in the United States, Canada and Mexico. Companies are ranked on the basis of annual revenue. To be included in the Top 100 or any of the sectors, please send contact information to tteditor@ttnews.com. We will contact you via phone or e-mail to get information about your company prior to publication of the next Top 100 list.
* Tractor count includes company-owned, lease-to-own and owner-operator tractors.
On the Bubble

Trucking Executives Cite Opportunities for AI Adoption

LAS VEGAS — Artificial intelligence promises to unlock greater efficiency in the freight transportation industry, but implementing AI functions is not without its challenges.
ArcBest Reports 31% Earnings Gain Despite Revenue Drop
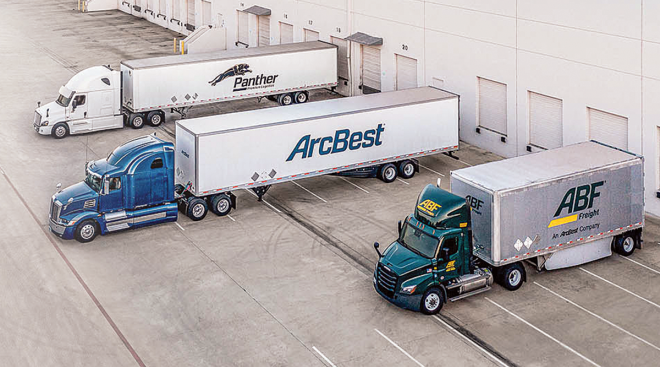
ArcBest Corp. experienced a 30.7% increase in earnings despite a decline in revenue during the fourth quarter of 2023, the company reported Feb. 6.
Auto Stoppages Push P.A.M. Transportation Into Red in Q4
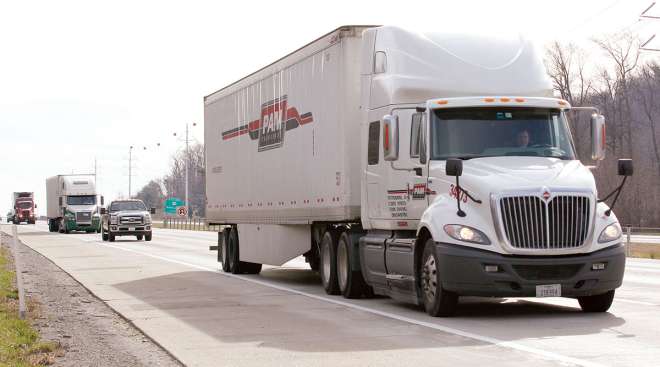
Labor stoppages at automotive manufacturers across the U.S. and a weak freight environment hit profits at carrier P.A.M. Transportation in the final three months of 2023, the company said.
Saia Targets Further Expansion Via $1 Billion in 2024 Capex
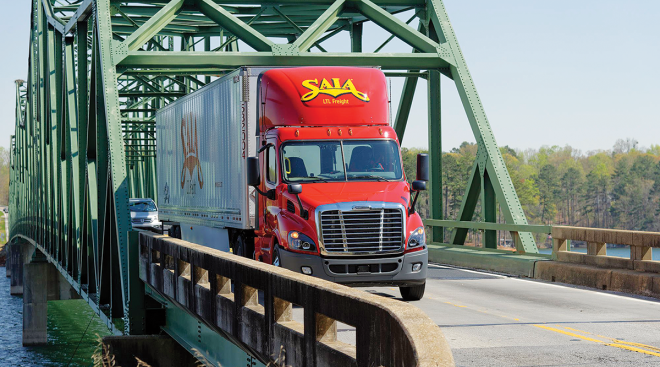
Saia Inc. expects 2024 to be another year of significant expansion after picking up business and terminals following the implosion of less-than-truckload rival Yellow Corp., executives said.
Fleets, Suppliers Work to Curb Fuel Card Skimming

Fuel card skimming is proving to be the most challenging and expensive fraud that carriers are facing.
VMRS Portal Is Nearly Here

The Vehicle Maintenance Reporting Standards system is undergoing major updates, including an online portal and codes for electric vehicles.
Schneider Reports 12% Revenue Decline for Q4
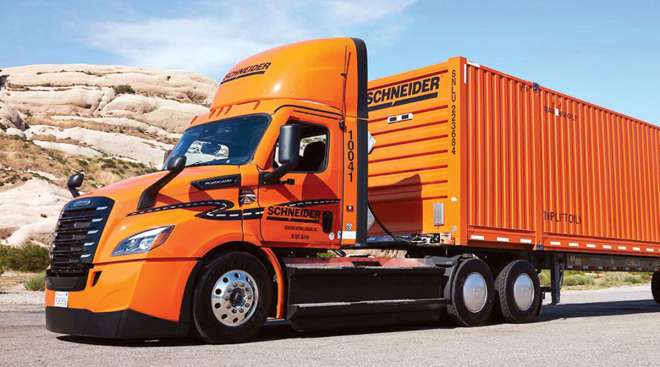
Schneider National experienced a year-over-year decline in profits as well as revenue during the fourth quarter of 2023, the company reported Feb. 1.
Landstar Reports 28% Revenue Decline for Q4
Landstar System Inc. posted declines in net income and revenue during the fourth quarter of 2023, the company reported Jan. 31.
Ryder to Acquire Cardinal Logistics
Ryder System Inc. is acquiring Cardinal Logistics in a deal that will add 2,900 power units, 3,400 drivers and 200 operating locations to its existing network.
Forward Air Completes Acquisition of Omni Logistics
Forward Air on Jan. 25 announced the completion of its long-pending acquisition of Omni Logistics, with both companies’ leaders touting the benefits of the merger.
-

2022
-
2021
-
2020
-
2019
-
2018
-
2017
-
2016
-
2015
-
2014
-
2013
-
2012
-
2011
-
2010
-
2009
-
2008
-
2007
-
2006
-
2005
-
2004


