


| Rank This Year | Rank Last Year | Company | Revenue (000) | Net Income (000) | Employees | Tractors* | Trailers |
|---|---|---|---|---|---|---|---|
| 1 | 1 | UPS Inc.
|
65,872,000 | 4,910,000 | 454,000 | 18,683 | 97,746 |
| 2 | 2 | FedEx Corp.
|
63,864,000 | 4,465,000 | 425,000 | 29,873 | 113,218 |
| 3 | 3 | XPO
|
15,380,800 | 312,400 | 95,000 | 16,287 | 27,591 |
| 4 | 4 | J.B. Hunt Transport Services
|
7,189,568 | 385,308 | 27,670 | 14,392 | 32,931 |
| 5 | 30 | Knight-Swift Transportation Holdings
|
5,136,261 | 529,922 | 25,400 | 23,069 | 74,949 |
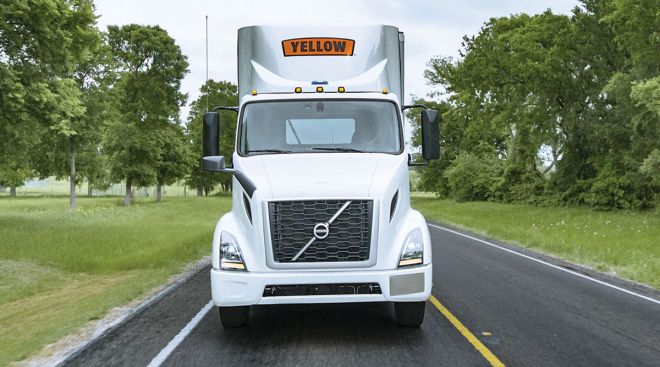
| 6 | 5 | Yellow Corp.
|
4,891,000 | -10,800 | 32,000 | 14,100 | 44,600 |
| 7 | 6 | Schneider
|
4,383,600 | 389,900 | 19,600 | 11,859 | 37,637 |
| 8 | 9 | Hub Group
|
4,034,897 | 135,153 | 4,377 | 3,520 | 5,850 |
| 9 | 10 | TFI International
|
3,906,575 | 130,181 | 17,044 | 16,132 | 24,617 |
| 10 | 9 | Landstar System
|
3,646,364 | 177,088 | 1,273 | 9,438 | 15,534 |
| 11 | 11 | Old Dominion Freight Line
|
3,358,112 | 463,774 | 20,944 | 8,316 | 32,890 |
| 12 | 13 | Ryder Supply Chain Solutions
|
3,065,500 | 158,400 | |||
| 13 | 12 | ArcBest
|
2,826,457 | 59,726 | 13,000 | 4,436 | 22,275 |
| 14 | 14 | Estes Express Lines
|
2,740,000 | - | 17,397 | 6,695 | 27,443 |
| 15 | 16 | Werner Enterprises
|
2,116,737 | 92,000 | 12,154 | 7,480 | 24,500 |
| 16 | 15 | Roadrunner Freight
|
2,091,300 | -91,200 | 4,600 | 3,625 | 6,920 |
| 17 | 27 | NFI
|
1,910,000 | - | 10,000 | 4,000 | 8,900 |
| 18 | 18 | Prime Inc.
|
1,875,031 | 208,184 | 4,300 | 6,296 | 12,753 |
| 19 | 21 | Penske Logistics
|
1,700,000 | - | 18,011 | 2,935 | 9,108 |
| 19 | 17 | UniGroup
|
1,700,000 | - | |||
| 21 | 21 | U.S. Xpress Enterprises
|
1,600,000 | - | 9,522 | 6,600 | 16,800 |
| 22 | 24 | R+L Carriers
|
1,580,000 | - | 5,084 | 15,675 | |
| 23 | 19 | CRST The Transportation Solution
|
1,555,000 | - | 7,538 | 5,774 | 12,145 |
| 24 | 25 | Kenan Advantage Group
|
1,441,440 | - | 9,000 | 6,686 | 10,744 |
| 25 | 26 | C.R. England
|
1,405,411 | - | 7,975 | 4,213 | 6,116 |
| 26 | 21 | Sirva Inc.
|
1,400,000 | - | |||
| 27 | 28 | Saia Inc.
|
1,378,510 | 91,156 | 9,800 | 4,259 | 13,901 |
| 28 | 20 | Purolator
|
1,343,111 | - | 10,000 | 465 | 1,329 |
| 29 | 42 | Daseke Inc.
|
1,300,000 | 26,996 | 4,700 | 5,200 | 11,500 |
| 30 | 29 | Southeastern Freight Lines
|
1,260,050 | - | 8,792 | 3,635 | 11,697 |
| 31 | 32 | Universal Logistics Holdings
|
1,216,665 | 28,153 | 8,231 | 3,784 | 5,765 |
| 32 | 31 | Averitt Express
|
1,146,970 | 98,967 | 8,500 | 4,513 | 14,585 |
| 33 | 37 | Forward Air
|
1,100,816 | 87,321 | 4,898 | 964 | 6,464 |
| 34 | 35 | Crete Carrier Corp.
|
1,100,000 | - | 6,000 | 5,400 | 14,000 |
| 35 | 33 | Celadon Group Inc.
|
1,065,356 | - | 5,200 | 3,850 | 10,000 |
| 36 | 34 | Anderson Trucking Service
|
1,004,301 | - | 1,996 | 2,652 | 6,958 |
| 37 | 38 | KLLM Transport Services
|
959,000 | - | 3,800 | 5,700 | |
| 38 | 39 | Lynden
|
950,000 | - | 2,600 | 768 | 2,889 |
| 39 | 59 | Evans Delivery
|
898,000 | - | 376 | 5,014 | 550 |
| 40 | 41 | Atlas World Group
|
842,100 | 4,800 | 671 | 1,271 | 4,076 |
| 41 | 40 | Ruan
|
836,298 | - | 5,500 | 2,900 | 8,710 |
| 42 | 43 | Quality Carriers
|
786,000 | - | 2,541 | 5,204 | |
| 43 | 44 | Central Transport International
|
754,000 | - | 3,180 | 6,543 | |
| 44 | 36 | Cardinal Logistics
|
720,000 | - | 4,245 | 2,905 | 7,940 |
| 45 | 51 | Day & Ross
|
718,941 | - | 2,240 | 1,800 | 5,714 |
| 46 | 50 | Pitt Ohio Transportation Group
|
715,827 | - | 5,381 | 1,856 | 5,372 |
| 47 | 47 | Covenant Logistics Group
|
705,007 | 55,439 | 4,297 | 2,700 | 7,389 |
| 48 | 46 | Marten Transport
|
698,120 | 90,284 | 3,492 | 2,738 | 4,909 |
| 49 | 49 | Stevens Transport
|
694,980 | 83,845 | 2,925 | 2,810 | 4,010 |
| 50 | 53 | AAA Cooper Transportation
|
665,000 | - | 5,000 | 3,000 | 6,500 |
| 51 | 56 | United Road Services
|
645,000 | - | 1,700 | 1,850 | 1,150 |
| 52 | 58 | Mullen Group
|
627,372 | - | 3,535 | 1,919 | 5,065 |
| 53 | 52 | Heartland Express
|
607,336 | 75,173 | 3,800 | 6,719 | 19,975 |
| 54 | 48 | Jack Cooper Holdings
|
602,825 | 74,839 | 3,753 | 2,637 | |
| 55 | 61 | PS Logistics
|
595,780 | - | 3,000 | 2,500 | |
| 56 | 45 | Trimac Transportation
|
576,796 | - | 3,200 | 1,720 | 3,800 |
| 57 | 56 | OnTrac Inc.
|
572,856 | - | 36 | 950 | |
| 58 | 55 | Western Express
|
566,230 | 41,998 | 2,850 | 2,555 | 7,800 |
| 59 | 60 | Dayton Freight Lines
|
562,000 | - | 4,501 | 1,561 | 3,803 |
| 60 | 54 | Suddath
|
550,000 | - | |||
| 61 | 62 | Canada Cartage System
|
546,309 | - | 3,137 | 2,548 | 2,817 |
| 62 | 69 | Bennett International Group
|
512,874 | - | 1,023 | 1,345 | 2,126 |
| 63 | 63 | Mercer Transportation Co.
|
492,509 | - | 293 | 2,299 | 2,299 |
| 64 | Two Men and a Truck Movers
|
487,236 | - | 6,136 | |||
| 65 | 74 | Bison Transport
|
472,004 | - | 2,944 | 1,704 | 4,732 |
| 66 | 67 | Cowan Systems
|
462,544 | - | 1,946 | 2,122 | 5,677 |
| 67 | 10 Roads Express
|
452,429 | - | 1,935 | 2,421 | ||
| 68 | 64 | Dart Transit Co.
|
451,925 | - | 2,626 | 2,131 | 7,159 |
| 69 | 70 | USA Truck (DB Schenker)
|
446,533 | 7,497 | 2,400 | 1,669 | 5,596 |
| 70 | 66 | Shevell Group
|
439,500 | - | 3,745 | 1,550 | 3,950 |
| 71 | 68 | P.A.M. Transport
|
437,838 | 38,899 | 2,409 | 2,281 | 5,795 |
| 72 | 72 | Mesilla Valley Transportation
|
430,261 | - | 1,760 | 1,450 | 6,000 |
| 73 | 71 | TransX Group of Companies
|
415,541 | - | 2,617 | 1,365 | 4,410 |
| 74 | 73 | TMC Transportation
|
413,000 | - | 2,613 | 3,404 | |
| 75 | 79 | Black Horse Carriers
|
412,500 | - | 3,150 | 1,670 | 3,500 |
| 76 | 81 | Epes Carriers Inc.
|
400,977 | 26,309 | 1,272 | 6,065 | |
| 77 | LaserShip Inc./OnTrac Inc.
|
400,000 | - | 29 | 27 | ||
| 78 | 76 | Roehl Transport
|
384,473 | - | 2,336 | 1,983 | 4,873 |
| 79 | 78 | A. Duie Pyle Inc.
|
373,000 | - | 2,697 | 946 | 1,936 |
| 80 | 80 | Maverick USA
|
352,068 | - | 2,122 | 1,648 | 2,480 |
| 81 | 87 | Transport Investments
|
339,920 | - | 190 | 1,037 | 1,846 |
| 82 | 84 | IMC Cos.
|
332,490 | - | 2,300 | 1,658 | 148 |
| 83 | 82 | Dicom Transportation Group
|
320,700 | - | |||
| 84 | 94 | Salmon Cos.
|
314,303 | - | 713 | 1,092 | |
| 85 | 83 | Cassens Transport Co.
|
302,004 | - | 1,265 | 1,231 | 1,231 |
| 86 | 88 | TransAm Trucking
|
280,000 | - | 1,135 | 1,823 | |
| 87 | 92 | Hirschbach Motor Lines
|
278,494 | - | 800 | 1,250 | 1,965 |
| 88 | 91 | Foodliner/Quest Liner
|
277,471 | - | 1,190 | 1,183 | 2,233 |
| 89 | 85 | Koch Cos.
|
277,000 | - | 1,190 | 1,053 | 5,476 |
| 90 | 86 | Dependable Supply Chain Services
|
274,000 | - | 344 | 1,220 | |
| 91 | 90 | Trans-System Inc.
|
271,000 | - | 1,050 | 1,000 | 1,700 |
| 92 | Melton Truck Lines
|
269,785 | - | 1,569 | 1,310 | 2,111 | |
| 93 | 77 | Central Freight Lines
|
266,000 | - | 2,001 | 8,012 | |
| 94 | 97 | Martin Transportation Systems
|
261,403 | - | 1,725 | 1,060 | 2,250 |
| 95 | 100 | Quantix Supply Chain Solutions
|
259,370 | - | 1,100 | 858 | 1,132 |
| 96 | 89 | Challenger Motor Freight
|
258,734 | - | 1,850 | 1,469 | 3,300 |
| 97 | 93 | United Vision Logistics
|
256,000 | - | 1,003 | 1,347 | |
| 98 | 99 | Superior Bulk Logistics
|
252,300 | 14,500 | 1,370 | 1,100 | 2,000 |
| 99 | 96 | John Christner Trucking
|
244,696 | 13,138 | 222 | 809 | 1,112 |
| 100 | Acme Truck Line
|
239,000 | - | 1,900 | 1,315 | 1,314 |
Top For-Hire Carriers on this list are common and contract freight carriers operating in the United States, Canada and Mexico. Companies are ranked on the basis of annual revenue. To be included in the Top 100 or any of the sectors, please send contact information to tteditor@ttnews.com. We will contact you via phone or e-mail to get information about your company prior to publication of the next Top 100 list.
* Tractor count includes company-owned, lease-to-own and owner-operator tractors.
On the Bubble

TFI Q2 Profit Dips by More Than 50% on Lower Freight Volumes
Profits at TFI International Inc. more than halved in the second quarter of 2023 to $128.2 million from $276.8 million in the year-ago period, the company said.
Nikola Begins Production of Hydrogen Fuel Cell Class 8 Truck
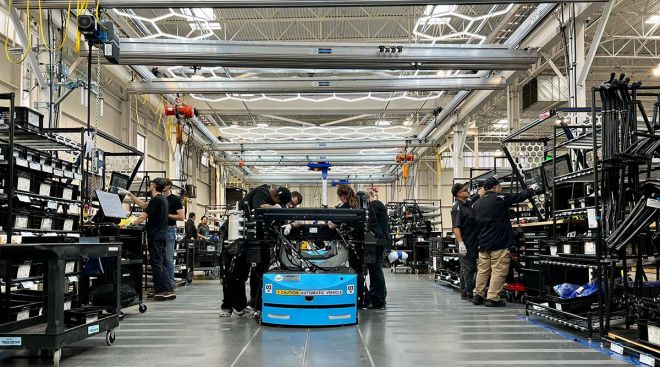
Nikola began production of the Tre hydrogen fuel cell electric truck July 31 at its Coolidge, Ariz., factory, the company said.
Yellow Reportedly Working on Loan From Apollo
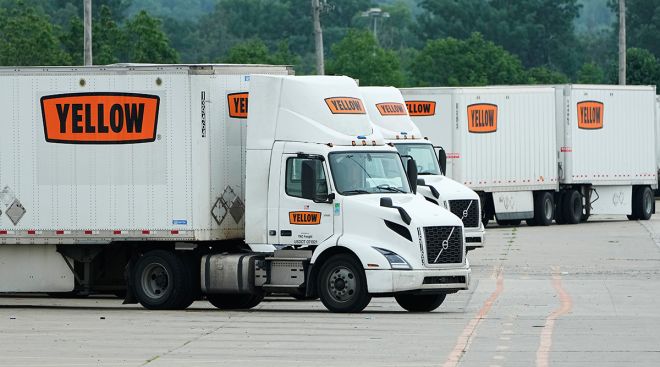
Creditors led by Apollo Global Management Inc. are nearing a deal to provide Yellow Corp. with fresh cash during a coming bankruptcy, according to people with knowledge of the matter.
August 1, 2023UPS-Teamsters Contract Takes Step Forward
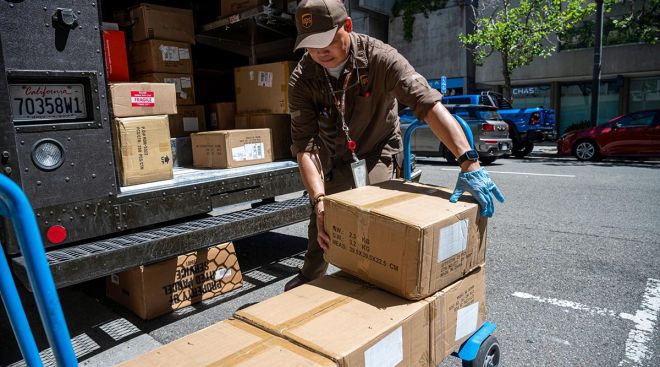
Local union leaders voted in favor of a tentative labor agreement that UPS and the Teamsters reached July 25, an important step toward finalizing a deal that covers about 340,000 workers.
Saia Reports Lower Q2 Profit, Revenue
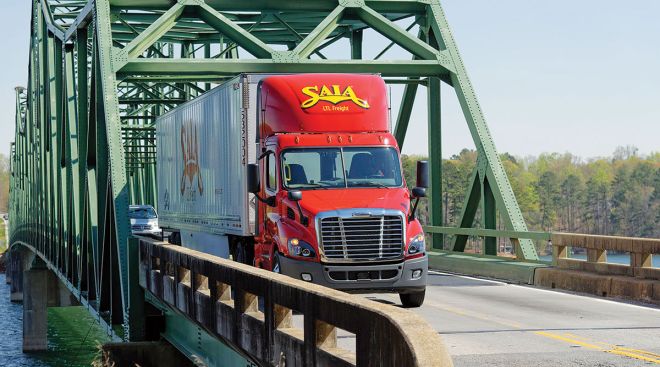
Saia Inc. posted net income of $91.3 million in the second quarter of 2023, compared with $109.2 million in the same period a year earlier, the less-than-truckload carrier said.
Georgia Distribution Center to Team NFI, Bradshaw Home
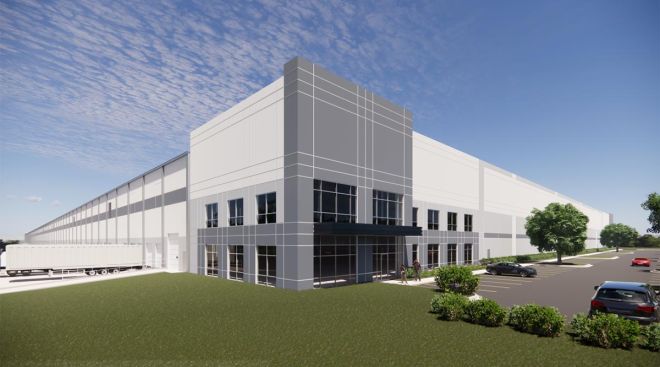
Georgia officials announced plans to open a new East Coast distribution center in Effingham County to bring Bradshaw Home’s products to customers faster through a partnership with NFI.
Old Dominion Freight Line Q2 Profit Falls 22.3% Year-On-Year
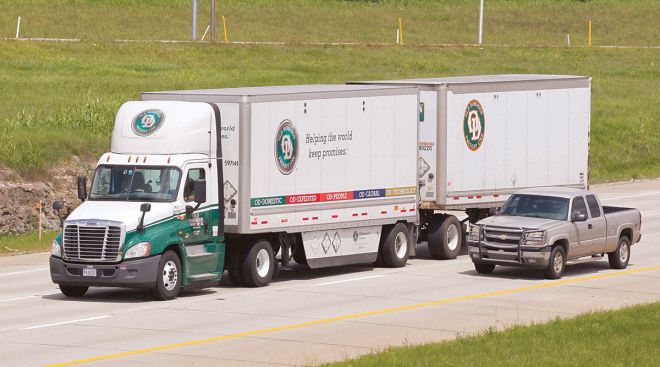
Old Dominion Freight Line Inc. profits fell 22.3% year-over-year to $292.4 million in the second quarter of 2023 from $376.1 million in the year-ago period, it said.
ArcBest Q2 Profit More Than Halves on Weak Demand
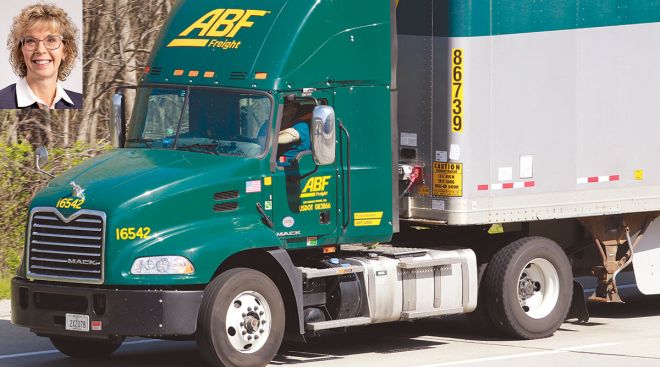
ArcBest posted lower earnings and revenue on weaker demand for the second quarter, the Fort Smith, Ark.-based carrier announced July 28.
Yellow Ceases Operations
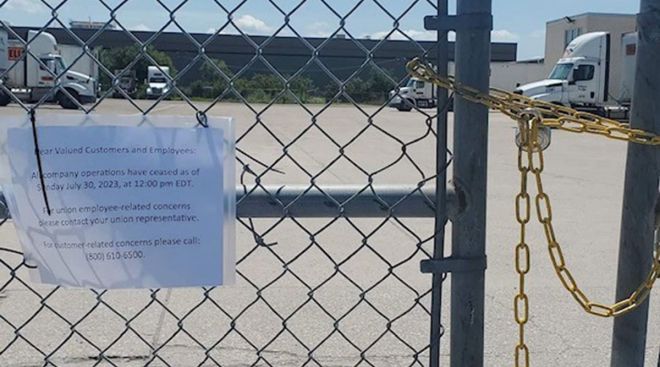
Less-than-truckload company Yellow shut down operations, ending a nearly 100-year history as one of the nation’s largest carriers, and the company began posting notices at terminals.
Yellow Puts Logistics Division Up for Sale
Yellow Corp. says it is shopping its third-party logistics broker, Yellow Logistics, to raise cash as the less-than-truckload company attempts to remain in business.
-

2022
-
2021
-
2020
-
2019
-
2018
-
2017
-
2016
-
2015
-
2014
-
2013
-
2012
-
2011
-
2010
-
2009
-
2008
-
2007
-
2006
-
2005
-
2004


