


Top 100 Private | Food Service | Grocery | Beverage | Petroleum/Chemical | Industrial Gases | Agriculture/Food Processing | Wholesale/Retail | Manufacturing
Equipment Rental | Building Materials | Waste Management | Paper/Office Products | Construction | Health Care | Uniform Rental | Media & Entertainment
| Rank This Year | Rank Last Year | Company | Tractors | Trucks | Pickups/ Cargo Vans | Trailers | Annual Revenue |
|---|---|---|---|---|---|---|---|
| 1 | 1 | PepsiCo Inc. |
11,100 | 3,500 | 20,600 | 17,500 | $63.5 billion |
| 2 | 2 | Sysco Corp. |
8,577 | 1,202 | - | 10,696 | $55.4 billion |
| 3 | 3 | Walmart Inc. |
6,472 | 145 | - | 61,640 | $500.3 billion |
| 4 | 6 | Reyes Holdings |
5,443 | 804 | 1,250 | 6,659 | $26.5 billion |
| 5 | 7 | Halliburton Co. |
5,382 | 2,885 | 254 | 10,362 | $20.6 billion |
| 6 | 5 | U.S. Foods |
5,336 | 389 | - | 6,650 | $24.0 billion |
| 7 | 8 | Nutrien |
4,349 | 2,261 | 8,622 | 8,554 | $13.7 billion |
| 8 | 9 | McLane Co. |
3,941 | 135 | 31 | 5,750 | - |
| 9 | 11 | Schlumberger Limited |
3,652 | 517 | 249 | 5,107 | $30.4 billion |
| 10 | 12 | Performance Food Group |
2,835 | 214 | - | 3,810 | $16.8 billion |
| 11 | 13 | Tyson Foods |
2,819 | 40 | 1,390 | 7,329 | $38.3 billion |
| 12 | 14 | Keurig Dr Pepper |
2,331 | 86 | 538 | 2,749 | $6.4 billion |
| 13 | 10 | C & J Energy Services |
2,306 | 454 | - | 3,715 | $1.6 billion |
| 14 | 20 | Basic Energy Services |
1,686 | 386 | - | 1,819 | $0.9 billion |
| 15 | 24 | United Rentals Inc. |
1,673 | 3,069 | - | 1,291 | $6.6 billion |
| 16 | 18 | CHS Inc. |
1,595 | 2,002 | - | 11,247 | $31.9 billion |
| 17 | 19 | Gordon Food Service |
1,519 | 17 | - | 2,041 | - |
| 18 | 17 | American Air Liquide Holdings |
1,472 | 4,184 | - | 2,331 | $23.7 billion |
| 19 | 23 | Albertsons Cos. |
1,450 | 1,030 | 75 | 5,300 | $59.9 billion |
| 20 | 44 | Coca-Cola Bottling Co. United |
1,427 | 513 | - | 1,915 | - |
| 21 | 25 | Clean Harbors Inc. |
1,375 | 5,187 | 21 | 4,361 | $2.9 billion |
| 22 | 26 | Dot Foods |
1,353 | 5 | 18 | 2,190 | - |
| 23 | 31 | The Quikrete Cos. |
1,248 | 47 | - | 1,899 | - |
| 24 | 27 | Gibson Energy Inc. |
1,200 | - | - | 2,500 | $6.1 billion |
| 25 | 30 | Sunbelt Rentals |
1,191 | 2,681 | - | 1,524 | $4.2 billion |
| 26 | FTS International |
1,116 | 178 | - | 1,485 | $1.5 billion |
|
| 27 | 41 | Core-Mark Holding Co. |
1,108 | 134 | - | 1,469 | $15.7 billion |
| 28 | 28 | Calfrac Well Services |
1,102 | 364 | - | 1,751 | $1.5 billion |
| 28 | 21 | Femsa Logistica |
1,102 | 1,100 | - | 2,130 | - |
| 30 | 37 | Ben E. Keith Co. |
1,066 | 82 | - | 1,333 | - |
| 31 | 57 | Ahold USA/Delhaize America |
1,062 | 714 | - | 4,560 | $44.5 billion |
| 32 | 33 | Pilot Flying J Inc. |
1,061 | 35 | - | 1,405 | - |
| 33 | 35 | Cemex USA |
1,030 | 3,354 | - | 1,689 | $3.5 billion |
| 34 | 32 | Praxair Inc. |
1,021 | 1,518 | - | 3,188 | $11.4 billion |
| 35 | 36 | Helena Chemical Co. |
1,004 | 2,507 | - | 2,575 | - |
| 36 | 43 | United Natural Foods |
943 | 6 | - | 1,084 | $9.3 billion |
| 37 | 39 | Builders FirstSource Inc. |
940 | 2,312 | - | 1,639 | $7.0 billion |
| 38 | 45 | Walgreen Co. |
920 | 24 | - | 2,387 | $118.2 billion |
| 39 | 69 | Maxim Crane Works |
903 | 99 | - | 1,428 | - |
| 40 | 22 | The Kroger Co. |
879 | 35 | - | 11,211 | $122.7 billion |
| 41 | 48 | Ashley Furniture Industries |
870 | 7 | - | 3,710 | - |
| 42 | 97 | BlueLinx Holdings |
836 | 47 | - | 881 | $1.8 billion |
| 42 | 38 | Veritiv Corp. |
836 | 97 | 149 | 1,415 | $8.4 billion |
| 44 | 34 | Darling Ingredients Inc. |
835 | 930 | 355 | 4,077 | $3.7 billion |
| 45 | 40 | Key Energy Services |
790 | 805 | - | 6,034 | $0.4 billion |
| 46 | 73 | Mondelez International |
779 | 106 | - | 996 | $26.0 billion |
| 47 | 16 | Dean Foods Co. |
765 | 761 | - | 2,262 | $7.8 billion |
| 48 | 47 | Prairie Farms Dairy |
761 | 1,218 | - | 2,431 | $3.0 billion |
| 49 | 54 | ABC Supply Co. |
750 | 2,400 | 262 | 1,000 | - |
| 50 | 53 | Love's Travel Stops & Country Stores |
740 | - | - | 780 | - |
| 50 | 49 | Univar Inc. |
740 | 125 | - | 1,775 | $8.3 billion |
| 52 | 42 | Plains All American Pipeline |
730 | - | - | 900 | $26.0 billion |
| 53 | 61 | Shaw Industries Group |
725 | 60 | - | 3,210 | - |
| 54 | 46 | Food Services of America |
714 | 50 | - | 820 | - |
| 55 | 52 | Southern Glazer's Wine and Spirits |
702 | 2,203 | - | 1,118 | - |
| 56 | 59 | Supervalu Inc. |
694 | 5 | - | 2,637 | $14.2 billion |
| 57 | 75 | SE Independent Delivery Services |
691 | 103 | - | 1,202 | - |
| 58 | 80 | Bunzl Distribution USA |
686 | - | 37 | 1,168 | $6.5 billion |
| 59 | 83 | Beacon Roofing Supply |
682 | 1,436 | - | 1,168 | $4.4 billion |
| 60 | 68 | Golden State Foods |
681 | 33 | - | 877 | $7.0 billion |
| 61 | 55 | Advanced Drainage Systems |
675 | - | - | 1,200 | $1.3 billion |
| 62 | Coca-Cola Bottling Co. of Northern New England |
672 | 100 | - | 890 | - | |
| 63 | 56 | Swire Coca-Cola USA |
669 | 242 | - | 801 | $1.8 billion |
| 64 | 60 | Sherwin-Williams Co. |
667 | 1 | - | 1,670 | $15.0 billion |
| 65 | 50 | Anheuser-Busch Cos. |
666 | 133 | - | 773 | - |
| 66 | 65 | JBS USA Holdings |
665 | - | - | 1,430 | $26.8 billion |
| 67 | 62 | Publix Super Markets |
659 | 18 | 414 | 3,265 | $34.6 billion |
| 68 | 58 | Shamrock Foods |
655 | 75 | 75 | 1,098 | - |
| 69 | 98 | Select Energy Services |
653 | 630 | - | 1,763 | $0.7 billion |
| 70 | 63 | Cudd Energy Services |
638 | 239 | - | 881 | - |
| 71 | ProPetro Holding Corp. |
630 | 43 | - | 773 | $1.0 billion |
|
| 72 | Liberty Coca-Cola Beverages |
620 | 231 | - | 768 | - | |
| 73 | 66 | Energy Transfer Partners |
605 | 95 | - | 712 | $29.0 billion |
| 74 | 71 | Archer Daniels Midland (ADM) Co. |
602 | 87 | - | 1,702 | $60.8 billion |
| 75 | Coca-Cola Beverages Florida |
598 | 14 | - | 657 | - | |
| 76 | 78 | Air Products Inc. |
589 | 94 | 330 | 2,000 | $8.2 billion |
| 77 | 64 | Brenntag North America |
587 | 80 | - | 1,487 | - |
| 78 | 74 | Nestle USA |
581 | 3,353 | - | 1,435 | $26.7 billion |
| 79 | Williams Brothers Construction |
575 | 200 | - | 253 | - | |
| 80 | 15 | Baker Hughes |
571 | 63 | - | 355 | $22.0 billion |
| 81 | 77 | C&S Wholesale Grocers |
567 | - | - | 1,613 | - |
| 82 | 79 | MDU Resources Group Inc. |
563 | 1,797 | - | 1,844 | $4.4 billion |
| 83 | 80 | Stericycle Inc. |
556 | 3,762 | - | 2,095 | $3.6 billion |
| 84 | 82 | Foster Farms |
536 | 96 | 10 | 1,621 | - |
| 85 | 84 | Gravity Oilfield Services |
529 | 69 | - | 541 | - |
| 86 | 76 | H.E.B. Grocery Co. |
517 | 5 | - | 2,355 | - |
| 87 | 85 | Linde North America |
508 | 1,877 | - | 1,421 | - |
| 88 | 87 | Mohawk Industries |
488 | 159 | - | 2,217 | $9.5 billion |
| 89 | 90 | Ace Hardware Corp. |
469 | 1 | 1 | 1,440 | $5.4 billion |
| 90 | 88 | Valley Proteins Inc. |
466 | 151 | 54 | 1,198 | - |
| 91 | Medline Inc. |
462 | 121 | - | 547 | $10.0 billion |
|
| 92 | 72 | Oldcastle Inc. |
460 | 894 | 2 | 1,266 | - |
| 93 | 100 | Herc Rentals |
444 | 300 | - | 447 | $1.8 billion |
| 94 | 91 | Pepsi Bottling Ventures |
441 | 141 | 176 | 609 | - |
| 94 | 93 | The H.T. Hackney Co. |
441 | 172 | - | 578 | - |
| 96 | 89 | KeHE Distributors |
438 | 1 | 1 | 742 | - |
| 97 | 92 | Sanderson Farms Inc. |
436 | 31 | - | 706 | $3.3 billion |
| 98 | 94 | Bragg Cos. |
433 | - | - | 682 | - |
| 98 | 67 | Nuverra Environmental Solutions |
433 | 180 | - | 553 | $0.2 billion |
| 100 | 95 | Dunkin' Brands Group |
430 | 12 | - | 450 | $0.9 billion |
The Top 100 Private Carriers Companies on this list operate their own trucks to carry freight and are ranked on the basis of the total number of highway tractors in the fleet. To be included in the Top 100 list, please send contact information to tteditor@ttnews.com. We will contact you via phone or e-mail to get information about your company prior to publication of the next Top 100 list.
On the Bubble
Pie From the Sky? Walmart Drone Deliveries Take Off
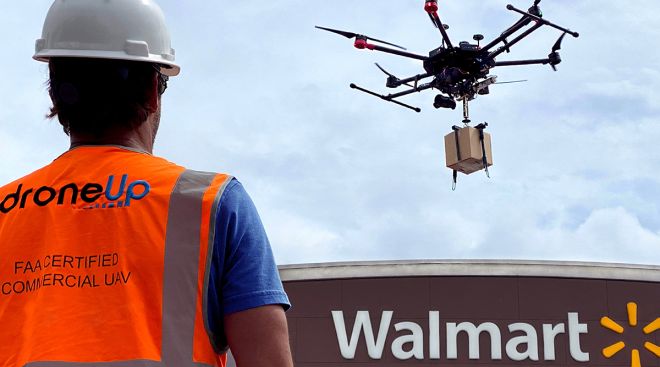
Drone delivery is no longer a thing of the future. It’s happening in Hampton Roads, Va., and soon, at Walmart stores across the country.
More Amazon Layoffs: 9,000 on Top of the 18,000 in January
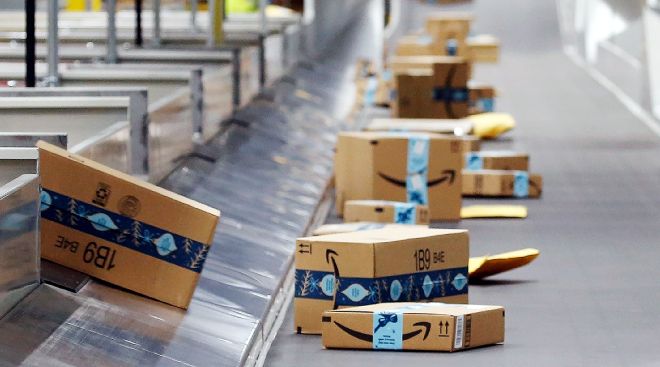
NEW YORK — Amazon plans to eliminate 9,000 more jobs in the next few weeks, CEO Andy Jassy said in a memo to staff on March 20.
March 20, 2023Automated Truck Developer Gatik to Make Kroger Deliveries
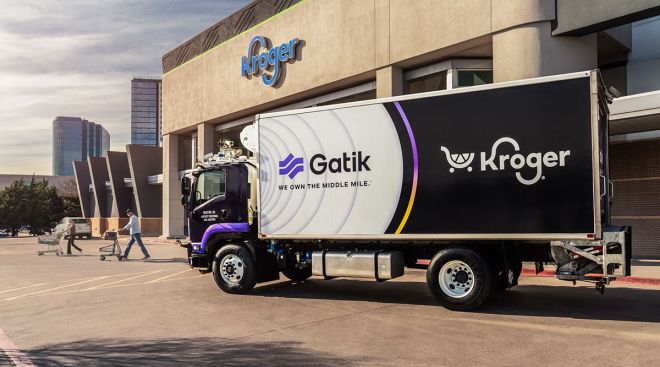
Autonomous technology developer Gatik is partnering with grocery store chain Kroger for deliveries via automated medium-duty trucks in the Dallas area.
Walmart Beats Q4 Expectations, Remains Cautious on Guidance
NEW YORK — Walmart on Feb. 21 reported strong sales during the holiday season as budget-conscious consumers looking for better deals on groceries and other items flocked to its stores.
Amazon Revenue Beats Q4 Estimates, Profits Slump
NEW YORK — Amazon on Feb. 2 reported worse-than-expected profits, but its revenue beat expectations, boosted by sales in North America businesses and the cloud-computing unit AWS.
Fleets, Tech Developers Chart Course to More Sustainable, Efficient Supply Chains
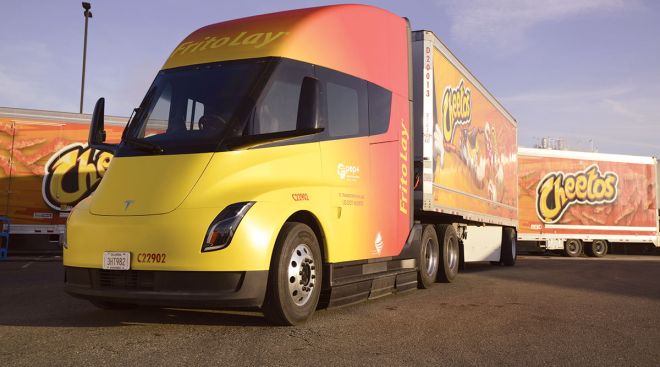
LAS VEGAS — Electric and autonomous vehicles can help build more sustainable and efficient supply chains, but the freight transportation sector will need to overcome various challenges to realize their potential.
Amazon to Sell Bay Area Office Complex as Sales Growth Cools
Amazon .com Inc. is selling a vacant Bay Area office complex purchased about 16 months ago, the company’s latest effort to unwind a pandemic-era expansion that left it with a surfeit of warehouses and employees.
Amazon Expands Prime Service to More Stores
Amazon.com Inc. is expanding a program that lets Prime subscribers use the company’s speedy delivery service when shopping on other websites.
Amazon to Slash More Than 18,000 Jobs in Escalation of Cuts
Amazon.com Inc. is laying off more than 18,000 employees — the biggest reduction in its history — in the latest sign that a tech-industry slump is deepening.
Last-Mile Focuses on Sustainable Shipping
The trucking industry has increased its focus on sustainability this year, mostly geared toward last-mile operations.
December 8, 2022-

2022
-
2021
-
2020
-
2019
-
2018
-
2017
-
2016
-
2015
-
2014
-
2013
-
2012
-
2011
-
2010
-
2009
-
2008
-
2007
-
2006
-
2005
-
2004


