


| Rank This Year | Rank Last Year | Company | Revenue (000) | Net Income (000) | Employees | Tractors* | Trailers |
|---|---|---|---|---|---|---|---|
| 2 | 2 | FedEx Corp.
|
91,683,000 | 6,118,000 | 577,000 | 37,488 | 136,947 |
| 1 | 1 | UPS Inc.
|
97,300,000 | 12,900,000 | 534,000 | 15,554 | 85,398 |
| 7 | 6 | Knight-Swift Transportation Holdings
|
6,000,000 | 966,000 | 27,900 | 21,351 | 75,019 |
| 5 | 5 | TFI International
|
7,220,000 | 664,000 | 29,539 | 22,812 | 50,091 |
| 11 | 11 | Ryder Supply Chain Solutions
|
4,612,000 | 166,000 | 41,900 | 70,700 | 43,500 |
| 10 | 8 | Yellow Corp.
|
5,122,000 | 104,000 | 32,000 | 14,200 | 42,000 |
| 9 | 10 | Old Dominion Freight Line
|
5,256,000 | 1,034,000 | 24,372 | 10,403 | 41,220 |
| 4 | 4 | J.B. Hunt Transport Services
|
12,168,000 | 760,800 | 34,978 | 18,617 | 39,994 |
| 8 | 7 | Schneider
|
5,600,000 | 405,000 | 16,050 | 11,300 | 36,700 |
| 12 | 12 | Estes Express Lines
|
4,447,000 | - | 21,700 | 8,500 | 34,000 |
| 17 | 17 | Werner Enterprises
|
2,734,000 | 259,000 | 13,525 | 8,775 | 27,225 |
| 3 | 3 | XPO
|
12,800,000 | 323,000 | 42,000 | 7,900 | 25,800 |
| 14 | 15 | ArcBest
|
3,980,000 | 214,000 | 14,000 | 4,360 | 23,438 |
| 19 | 19 | R+L Carriers
|
2,427,000 est |
- | 6,774 | 19,709 | |
| 21 | 20 | Saia Inc.
|
2,300,000 | 335,000 | 12,000 | 5,600 | 19,300 |
| 6 | 9 | Landstar System
|
6,538,000 | 721,000 | 1,399 | 11,864 | 18,307 |
| 32 | 36 | Averitt Express
|
1,532,000 | - | 9,000 | 5,090 | 15,071 |
| 20 | 18 | Prime Inc.
|
2,408,000 | 351,000 | 4,411 | 7,601 | 14,700 |
| 25 | 24 | CRST The Transportation Solution
|
1,800,000 | - | 6,536 | 4,894 | 14,289 |
| 15 | 14 | Penske Logistics
|
3,700,000 | - | 19,994 | 5,583 | 13,771 |
| 23 | 21 | U.S. Xpress Enterprises
|
1,949,000 | 11,000 | 8,689 | 6,400 | 13,600 |
| 16 | 16 | NFI
|
3,100,000 | - | 15,500 | 4,600 | 13,000 |
| 37 | 37 | Crete Carrier Corp.
|
1,304,000 | - | 6,500 | 5,000 | 13,000 |
| 24 | 23 | Kenan Advantage Group
|
1,904,000 est |
- | 9,311 | 7,121 | 12,235 |
| 40 | 43 | Central Transport International
|
1,046,000 est |
- | 2,953 | 11,877 | |
| 31 | 26 | Daseke Inc.
|
1,557,000 | 56,000 | 4,006 | 4,697 | 11,266 |
| 66 | 56 | Heartland Express
|
607,000 | 79,000 | 3,180 | 3,193 | 10,741 |
| 34 | 31 | Day & Ross
|
1,489,000 | - | 8,400 | 4,600 | 9,150 |
| 45 | 51 | Western Express
|
977,000 | - | 4,400 | 3,150 | 8,400 |
| 38 | 35 | Ruan
|
1,227,820 | - | 5,500 | 3,475 | 8,210 |
| 35 | 34 | Southeastern Freight Lines
|
1,476,000 | - | 8,490 | 2,788 | 8,060 |
| 44 | 45 | Cardinal Logistics
|
981,000 | - | 4,200 | 3,025 | 8,000 |
| 51 | 38 | Quality Carriers
|
850,000 | - | 1,600 | 2,600 | 7,500 |
| 62 | 63 | Cowan Systems
|
655,000 | - | 2,301 | 2,346 | 7,487 |
| 81 | 80 | Dart Transit Co.
|
377,600 est |
- | 2,051 | 7,140 | |
| 30 | 32 | Anderson Trucking Service
|
1,567,000 | - | 2,325 | 2,588 | 7,082 |
| 58 | 71 | P.A.M. Transport
|
707,100 | 76,500 | 2,510 | 1,970 | 6,859 |
| 57 | 65 | USA Truck (DB Schenker)
|
710,000 | 25,000 | 2,069 | 2,157 | 6,548 |
| 27 | 33 | Forward Air
|
1,662,000 | 116,000 | 4,327 | 865 | 6,370 |
| 52 | 60 | Mullen Group
|
838,000 | - | 4,622 | 2,241 | 6,151 |
| 13 | 13 | Hub Group
|
4,232,000 | 171,000 | 5,000 | 3,600 | 6,100 |
| 48 | 41 | KLLM Transport Services
|
953,000 | - | 3,200 | 6,100 | |
| 53 | 57 | Bison Transport
|
778,000 | - | 3,732 | 2,115 | 6,057 |
| 73 | 78 | Mesilla Valley Transportation
|
494,000 | - | 2,616 | 1,796 | 6,000 |
| 29 | 25 | C.R. England
|
1,644,000 | - | 6,588 | 3,833 | 5,897 |
| 70 | 73 | Roehl Transport
|
521,000 | - | 2,968 | 2,074 | 5,883 |
| 36 | 40 | PS Logistics
|
1,375,000 | - | 3,100 | 3,625 | 5,700 |
| 85 | 86 | Koch Cos.
|
359,000 | - | 1,213 | 983 | 5,689 |
| 46 | 42 | Marten Transport
|
974,000 | 85,000 | 4,007 | 3,204 | 5,299 |
| 49 | 44 | 10 Roads Express
|
917,000 | - | 5,052 | 5,287 | |
| 40 | 46 | Covenant Logistics Group
|
1,046,000 | - | 5,600 | 2,563 | 5,213 |
| 68 | 64 | Heniff Transportation Systems
|
562,000 est |
- | 1,806 | 5,066 | |
| 60 | 55 | Dayton Freight Lines
|
684,000 | 145,000 | 5,593 | 1,813 | 4,970 |
| 33 | 30 | UniGroup
|
1,499,000 | - | 835 | 2,889 | 4,767 |
| 92 | New Legend Inc.
|
294,000 | 37,000 | 1,400 | 1,000 | 4,600 | |
| 75 | 74 | TMC Transportation
|
450,000 est |
- | 3,098 | 4,252 | |
| 89 | Western Flyer Express
|
320,000 | - | 1,150 | 4,000 | ||
| 50 | 48 | Pitt Ohio Transportation Group
|
900,000 | - | 5,087 | 1,565 | 3,995 |
| 64 | 66 | Hirschbach Motor Lines
|
626,000 | - | 1,990 | 2,299 | 3,861 |
| 26 | 29 | Universal Logistics Holdings
|
1,751,000 | - | 8,000 | 4,066 | 3,800 |
| 46 | 49 | Atlas World Group
|
974,000 | 17,000 | 655 | 1,653 | 3,615 |
| 55 | 58 | Stevens Transport
|
745,000 | 129,000 | 2,900 | 2,050 | 3,600 |
| 74 | 87 | Quantix Supply Chain Solutions
|
454,000 | -72,000 | 1,850 | 1,632 | 3,594 |
| 97 | Paschall Truck Lines
|
265,000 | - | 1,545 | 1,170 | 3,500 | |
| 82 | 85 | Red Classic
|
365,000 | - | 1,206 | 649 | 3,500 |
| 78 | 82 | Challenger Motor Freight
|
402,000 | - | 1,200 | 1,545 | 3,380 |
| 67 | 61 | Trimac Transportation
|
600,000 est |
- | 1,681 | 3,250 | |
| 100 | Paper Transport
|
244,000 | - | 1,100 | 850 | 3,200 | |
| 96 | Artur Express
|
272,000 | - | 471 | 776 | 3,047 | |
| 22 | 27 | Evans Delivery
|
2,050,000 | - | 650 | 9,000 | 3,000 |
| 63 | 69 | A. Duie Pyle Inc.
|
628,000 | - | 3,734 | 1,444 | 2,962 |
| 76 | 76 | Foodliner/Quest Liner
|
437,000 | - | 1,562 | 1,608 | 2,914 |
| 59 | 59 | Canada Cartage System
|
701,000 | - | 4,332 | 2,880 | 2,700 |
| 79 | 79 | Maverick USA
|
398,000 | - | 1,977 | 1,458 | 2,671 |
| 94 | Oak Harbor Freight Lines
|
284,000 est |
- | 1,700 | 777 | 2,487 | |
| 39 | 39 | Lynden
|
1,080,000 | - | 2,472 | 880 | 2,430 |
| 99 | 100 | Smith Transport
|
246,000 est |
- | 1,136 | 816 | 2,250 |
| 86 | 92 | Melton Truck Lines
|
338,000 | - | 1,611 | 1,233 | 2,191 |
| 95 | Transervice Logistics
|
278,300 | - | 1,200 | 366 | 2,181 | |
| 65 | 70 | Mercer Transportation Co.
|
614,000 | - | 247 | 2,180 | 2,180 |
| 56 | 52 | United Road Services
|
713,000 est |
- | 1,837 | 1,978 | 2,110 |
| 18 | 22 | Purolator
|
2,600,000 | 293,000 | 13,533 | 522 | 2,005 |
| 84 | 90 | Dupré Logistics
|
360,000 | 188,000 | 1,260 | 750 | 2,000 |
| 90 | 95 | Trans-System Inc.
|
315,000 | - | 990 | 940 | 1,886 |
| 42 | 54 | Bennett International Group
|
998,000 | - | 1,114 | 2,726 | 1,865 |
| 98 | 99 | PGT Trucking
|
253,700 | - | 695 | 1,138 | 1,825 |
| 72 | 77 | Fastfrate Group
|
500,000 | - | 3,000 | 1,152 | 1,644 |
| 71 | 68 | Jack Cooper Holdings
|
507,000 est |
- | 3,753 | 1,286 | 1,284 |
| 87 | 84 | John Christner Trucking
|
334,000 | 17,000 | 315 | 754 | 1,236 |
| 83 | Dependable Supply Chain Services
|
363,000 | - | 1,965 | 462 | 1,167 | |
| 88 | Leonard's Express
|
327,000 | - | 700 | 582 | 1,000 | |
| 61 | 83 | R&R Express
|
680,000 | - | 397 | 504 | 642 |
| 91 | Beemac Trucking
|
301,000 | - | 130 | 525 | 610 | |
| 43 | 72 | IMC Cos.
|
983,000 | - | 2,371 | 1,700 | 150 |
| 93 | 81 | ContainerPort Group
|
287,000 | - | 363 | 1,296 | 16 |
| 77 | 75 | Roadrunner Freight
|
430,000 est |
- | |||
| 80 | 94 | Daylight Transport
|
380,000 | - | |||
| 69 | 67 | Two Men and a Truck Movers
|
525,000 est |
- | 11,396 | ||
| 54 | 53 | AAA Cooper Transportation
|
776,000 | - | 5,000 | 2,650 | |
| 27 | 47 | OnTrac Inc.
|
1,662,000 est |
- |
Top For-Hire Carriers on this list are common and contract freight carriers operating in the United States, Canada and Mexico. Companies are ranked on the basis of annual revenue. To be included in the Top 100 or any of the sectors, please send contact information to tteditor@ttnews.com. We will contact you via phone or e-mail to get information about your company prior to publication of the next Top 100 list.
Revenues for the following carriers are estimated by SJ Consulting Group: R+L Carriers, LaserShip/OnTrac, Crete Carrier Corp., Central Transport International, Oak Harbor Freight Lines.
FedEx Corp. revenue is for 12-month period ended Feb. 28, 2022.
Ruan revenue is for 2020.
10 Roads Express revenue is estimated by Culhane Meadows Pllc.
United Road Services revenue is for 2019.
Trimac revenue is for 2020.
Heniff Transportation Systems revenue is estimated for 2020.
Two Men and a Truck revenue is for 2019.
Jack Cooper Holdings revenue is estimated by SJ Consulting Group for 2019.
TMC Transportation revenue is for 2019.
Roadrunner Freight revenue is for 2019.
Dart Transit Co. revenue is estimated by SJ Consulting Group for 2020.
PGT Trucking revenue is for 2020.
Smith Transport revenue is for 2020.
* Tractor count includes company-owned, lease-to-own and owner-operator tractors.


Amazon Delivery Rival Pandion Secures Funding for Expansion

E-commerce logistics startup Pandion — which helps retailers like Saks Fifth Avenue compete with Amazon’s delivery — has secured $41.5 million in fresh funds to expand its operation.
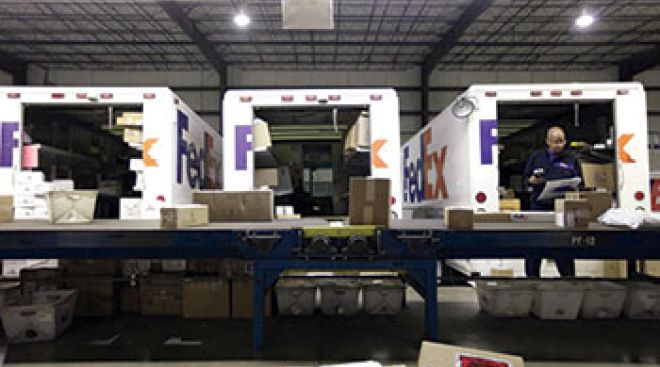
FedEx Plans $5 Billion Buyback of Shares

FedEx Corp. plans to buy back $5 billion of its shares as cost-cutting efforts have helped boost the courier’s profits as fiscal third-quarter earnings beat expectations.
March 21, 2024Aerolane Seeks to Use Freighter Planes to Pull Cargo Gliders

Aerolane is testing a business plan to pull cargo gliders with small freighter planes.
PS Logistics Buys Yordy Transport, Boosts Flatbed Ops Again
Diamond State Trucking & Logistics is to buy Morton, Ill.-based flatbed carrier Yordy Transport for an undisclosed sum, parent company PS Logistics said.
TFI Buys Hercules Forwarding to Boost US LTL Operations
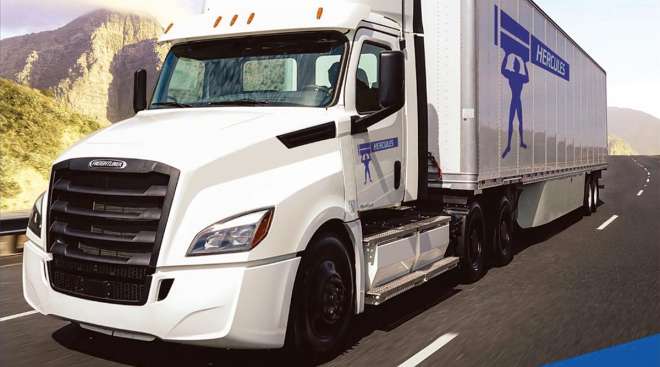
TFI International is to buy less-than-truckload carrier Hercules Forwarding Inc. for an undisclosed sum, it said.
PepsiCo, Estes Express Earn Sustainability Pathfinder Awards

NEW ORLEANS — Transport Topics has presented its inaugural Sustainability Pathfinder awards to PepsiCo and Estes Express in recognition of efforts to curb emissions and eliminate waste.
March 6, 2024Nearshoring Trend Drives More Border Growth
The nearshoring trend has been driving further transportation and logistics investments near the Mexican border as companies work to capture current and expected future growth.
Navistar Launches Integrated Powertrain
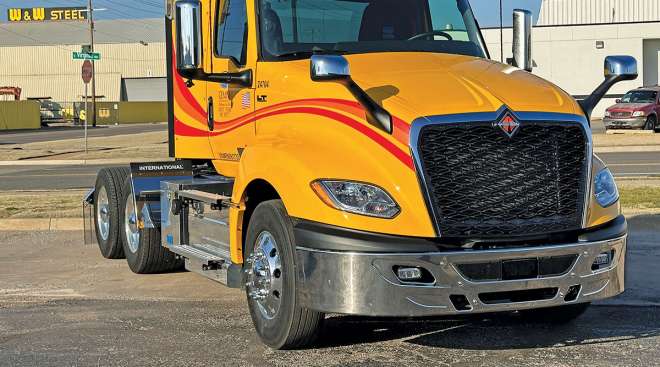
Truck maker Navistar announced Feb. 26 it has made the first deliveries of its International LT Series equipped with the International S13 Integrated Powertrain.
J.B. Hunt to Promote Shelley Simpson to CEO Post

J.B. Hunt Transport Services Inc. announced that company president Shelley Simpson is also taking on the post of CEO, effective July 1.
Forward Air Reports 138% Earnings Drop for Q4
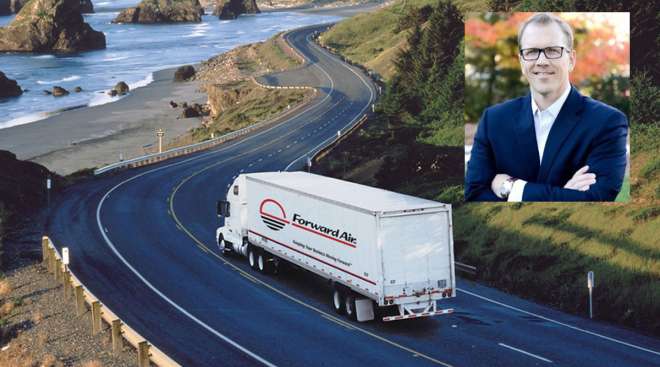
Forward Air Corp. experienced a 138% earnings drop year-over-year during the fourth quarter of 2023, the company reported Feb. 28.
-

2022
-
2021
-
2020
-
2019
-
2018
-
2017
-
2016
-
2015
-
2014
-
2013
-
2012
-
2011
-
2010
-
2009
-
2008
-
2007
-
2006
-
2005
-
2004


