


| Rank This Year | Rank Last Year | Company | Revenue (000) | Net Income (000) | Employees | Tractors* | Trailers |
|---|---|---|---|---|---|---|---|
| 2 | 2 | FedEx Corp.
|
91,683,000 | 6,118,000 | 577,000 | 37,488 | 136,947 |
| 1 | 1 | UPS Inc.
|
97,300,000 | 12,900,000 | 534,000 | 15,554 | 85,398 |
| 3 | 3 | XPO
|
12,800,000 | 323,000 | 42,000 | 7,900 | 25,800 |
| 11 | 11 | Ryder Supply Chain Solutions
|
4,612,000 | 166,000 | 41,900 | 70,700 | 43,500 |
| 4 | 4 | J.B. Hunt Transport Services
|
12,168,000 | 760,800 | 34,978 | 18,617 | 39,994 |
| 10 | 8 | Yellow Corp.
|
5,122,000 | 104,000 | 32,000 | 14,200 | 42,000 |
| 5 | 5 | TFI International
|
7,220,000 | 664,000 | 29,539 | 22,812 | 50,091 |
| 7 | 6 | Knight-Swift Transportation Holdings
|
6,000,000 | 966,000 | 27,900 | 21,351 | 75,019 |
| 9 | 10 | Old Dominion Freight Line
|
5,256,000 | 1,034,000 | 24,372 | 10,403 | 41,220 |
| 12 | 12 | Estes Express Lines
|
4,447,000 | - | 21,700 | 8,500 | 34,000 |
| 15 | 14 | Penske Logistics
|
3,700,000 | - | 19,994 | 5,583 | 13,771 |
| 8 | 7 | Schneider
|
5,600,000 | 405,000 | 16,050 | 11,300 | 36,700 |
| 16 | 16 | NFI
|
3,100,000 | - | 15,500 | 4,600 | 13,000 |
| 14 | 15 | ArcBest
|
3,980,000 | 214,000 | 14,000 | 4,360 | 23,438 |
| 18 | 22 | Purolator
|
2,600,000 | 293,000 | 13,533 | 522 | 2,005 |
| 17 | 17 | Werner Enterprises
|
2,734,000 | 259,000 | 13,525 | 8,775 | 27,225 |
| 21 | 20 | Saia Inc.
|
2,300,000 | 335,000 | 12,000 | 5,600 | 19,300 |
| 69 | 67 | Two Men and a Truck Movers
|
525,000 est |
- | 11,396 | ||
| 24 | 23 | Kenan Advantage Group
|
1,904,000 est |
- | 9,311 | 7,121 | 12,235 |
| 32 | 36 | Averitt Express
|
1,532,000 | - | 9,000 | 5,090 | 15,071 |
| 23 | 21 | U.S. Xpress Enterprises
|
1,949,000 | 11,000 | 8,689 | 6,400 | 13,600 |
| 35 | 34 | Southeastern Freight Lines
|
1,476,000 | - | 8,490 | 2,788 | 8,060 |
| 34 | 31 | Day & Ross
|
1,489,000 | - | 8,400 | 4,600 | 9,150 |
| 26 | 29 | Universal Logistics Holdings
|
1,751,000 | - | 8,000 | 4,066 | 3,800 |
| 29 | 25 | C.R. England
|
1,644,000 | - | 6,588 | 3,833 | 5,897 |
| 25 | 24 | CRST The Transportation Solution
|
1,800,000 | - | 6,536 | 4,894 | 14,289 |
| 37 | 37 | Crete Carrier Corp.
|
1,304,000 | - | 6,500 | 5,000 | 13,000 |
| 40 | 46 | Covenant Logistics Group
|
1,046,000 | - | 5,600 | 2,563 | 5,213 |
| 60 | 55 | Dayton Freight Lines
|
684,000 | 145,000 | 5,593 | 1,813 | 4,970 |
| 38 | 35 | Ruan
|
1,227,820 | - | 5,500 | 3,475 | 8,210 |
| 50 | 48 | Pitt Ohio Transportation Group
|
900,000 | - | 5,087 | 1,565 | 3,995 |
| 13 | 13 | Hub Group
|
4,232,000 | 171,000 | 5,000 | 3,600 | 6,100 |
| 54 | 53 | AAA Cooper Transportation
|
776,000 | - | 5,000 | 2,650 | |
| 52 | 60 | Mullen Group
|
838,000 | - | 4,622 | 2,241 | 6,151 |
| 20 | 18 | Prime Inc.
|
2,408,000 | 351,000 | 4,411 | 7,601 | 14,700 |
| 45 | 51 | Western Express
|
977,000 | - | 4,400 | 3,150 | 8,400 |
| 59 | 59 | Canada Cartage System
|
701,000 | - | 4,332 | 2,880 | 2,700 |
| 27 | 33 | Forward Air
|
1,662,000 | 116,000 | 4,327 | 865 | 6,370 |
| 44 | 45 | Cardinal Logistics
|
981,000 | - | 4,200 | 3,025 | 8,000 |
| 46 | 42 | Marten Transport
|
974,000 | 85,000 | 4,007 | 3,204 | 5,299 |
| 31 | 26 | Daseke Inc.
|
1,557,000 | 56,000 | 4,006 | 4,697 | 11,266 |
| 71 | 68 | Jack Cooper Holdings
|
507,000 est |
- | 3,753 | 1,286 | 1,284 |
| 63 | 69 | A. Duie Pyle Inc.
|
628,000 | - | 3,734 | 1,444 | 2,962 |
| 53 | 57 | Bison Transport
|
778,000 | - | 3,732 | 2,115 | 6,057 |
| 66 | 56 | Heartland Express
|
607,000 | 79,000 | 3,180 | 3,193 | 10,741 |
| 36 | 40 | PS Logistics
|
1,375,000 | - | 3,100 | 3,625 | 5,700 |
| 72 | 77 | Fastfrate Group
|
500,000 | - | 3,000 | 1,152 | 1,644 |
| 70 | 73 | Roehl Transport
|
521,000 | - | 2,968 | 2,074 | 5,883 |
| 55 | 58 | Stevens Transport
|
745,000 | 129,000 | 2,900 | 2,050 | 3,600 |
| 73 | 78 | Mesilla Valley Transportation
|
494,000 | - | 2,616 | 1,796 | 6,000 |
| 58 | 71 | P.A.M. Transport
|
707,100 | 76,500 | 2,510 | 1,970 | 6,859 |
| 39 | 39 | Lynden
|
1,080,000 | - | 2,472 | 880 | 2,430 |
| 43 | 72 | IMC Cos.
|
983,000 | - | 2,371 | 1,700 | 150 |
| 30 | 32 | Anderson Trucking Service
|
1,567,000 | - | 2,325 | 2,588 | 7,082 |
| 62 | 63 | Cowan Systems
|
655,000 | - | 2,301 | 2,346 | 7,487 |
| 57 | 65 | USA Truck (DB Schenker)
|
710,000 | 25,000 | 2,069 | 2,157 | 6,548 |
| 64 | 66 | Hirschbach Motor Lines
|
626,000 | - | 1,990 | 2,299 | 3,861 |
| 79 | 79 | Maverick USA
|
398,000 | - | 1,977 | 1,458 | 2,671 |
| 83 | Dependable Supply Chain Services
|
363,000 | - | 1,965 | 462 | 1,167 | |
| 74 | 87 | Quantix Supply Chain Solutions
|
454,000 | -72,000 | 1,850 | 1,632 | 3,594 |
| 56 | 52 | United Road Services
|
713,000 est |
- | 1,837 | 1,978 | 2,110 |
| 94 | Oak Harbor Freight Lines
|
284,000 est |
- | 1,700 | 777 | 2,487 | |
| 86 | 92 | Melton Truck Lines
|
338,000 | - | 1,611 | 1,233 | 2,191 |
| 51 | 38 | Quality Carriers
|
850,000 | - | 1,600 | 2,600 | 7,500 |
| 76 | 76 | Foodliner/Quest Liner
|
437,000 | - | 1,562 | 1,608 | 2,914 |
| 97 | Paschall Truck Lines
|
265,000 | - | 1,545 | 1,170 | 3,500 | |
| 92 | New Legend Inc.
|
294,000 | 37,000 | 1,400 | 1,000 | 4,600 | |
| 6 | 9 | Landstar System
|
6,538,000 | 721,000 | 1,399 | 11,864 | 18,307 |
| 84 | 90 | Dupré Logistics
|
360,000 | 188,000 | 1,260 | 750 | 2,000 |
| 85 | 86 | Koch Cos.
|
359,000 | - | 1,213 | 983 | 5,689 |
| 82 | 85 | Red Classic
|
365,000 | - | 1,206 | 649 | 3,500 |
| 78 | 82 | Challenger Motor Freight
|
402,000 | - | 1,200 | 1,545 | 3,380 |
| 95 | Transervice Logistics
|
278,300 | - | 1,200 | 366 | 2,181 | |
| 99 | 100 | Smith Transport
|
246,000 est |
- | 1,136 | 816 | 2,250 |
| 42 | 54 | Bennett International Group
|
998,000 | - | 1,114 | 2,726 | 1,865 |
| 100 | Paper Transport
|
244,000 | - | 1,100 | 850 | 3,200 | |
| 90 | 95 | Trans-System Inc.
|
315,000 | - | 990 | 940 | 1,886 |
| 33 | 30 | UniGroup
|
1,499,000 | - | 835 | 2,889 | 4,767 |
| 88 | Leonard's Express
|
327,000 | - | 700 | 582 | 1,000 | |
| 98 | 99 | PGT Trucking
|
253,700 | - | 695 | 1,138 | 1,825 |
| 46 | 49 | Atlas World Group
|
974,000 | 17,000 | 655 | 1,653 | 3,615 |
| 22 | 27 | Evans Delivery
|
2,050,000 | - | 650 | 9,000 | 3,000 |
| 96 | Artur Express
|
272,000 | - | 471 | 776 | 3,047 | |
| 61 | 83 | R&R Express
|
680,000 | - | 397 | 504 | 642 |
| 93 | 81 | ContainerPort Group
|
287,000 | - | 363 | 1,296 | 16 |
| 87 | 84 | John Christner Trucking
|
334,000 | 17,000 | 315 | 754 | 1,236 |
| 65 | 70 | Mercer Transportation Co.
|
614,000 | - | 247 | 2,180 | 2,180 |
| 91 | Beemac Trucking
|
301,000 | - | 130 | 525 | 610 | |
| 77 | 75 | Roadrunner Freight
|
430,000 est |
- | |||
| 48 | 41 | KLLM Transport Services
|
953,000 | - | 3,200 | 6,100 | |
| 80 | 94 | Daylight Transport
|
380,000 | - | |||
| 49 | 44 | 10 Roads Express
|
917,000 | - | 5,052 | 5,287 | |
| 81 | 80 | Dart Transit Co.
|
377,600 est |
- | 2,051 | 7,140 | |
| 19 | 19 | R+L Carriers
|
2,427,000 est |
- | 6,774 | 19,709 | |
| 67 | 61 | Trimac Transportation
|
600,000 est |
- | 1,681 | 3,250 | |
| 68 | 64 | Heniff Transportation Systems
|
562,000 est |
- | 1,806 | 5,066 | |
| 40 | 43 | Central Transport International
|
1,046,000 est |
- | 2,953 | 11,877 | |
| 89 | Western Flyer Express
|
320,000 | - | 1,150 | 4,000 | ||
| 75 | 74 | TMC Transportation
|
450,000 est |
- | 3,098 | 4,252 | |
| 27 | 47 | OnTrac Inc.
|
1,662,000 est |
- |
Top For-Hire Carriers on this list are common and contract freight carriers operating in the United States, Canada and Mexico. Companies are ranked on the basis of annual revenue. To be included in the Top 100 or any of the sectors, please send contact information to tteditor@ttnews.com. We will contact you via phone or e-mail to get information about your company prior to publication of the next Top 100 list.
Revenues for the following carriers are estimated by SJ Consulting Group: R+L Carriers, LaserShip/OnTrac, Crete Carrier Corp., Central Transport International, Oak Harbor Freight Lines.
FedEx Corp. revenue is for 12-month period ended Feb. 28, 2022.
Ruan revenue is for 2020.
10 Roads Express revenue is estimated by Culhane Meadows Pllc.
United Road Services revenue is for 2019.
Trimac revenue is for 2020.
Heniff Transportation Systems revenue is estimated for 2020.
Two Men and a Truck revenue is for 2019.
Jack Cooper Holdings revenue is estimated by SJ Consulting Group for 2019.
TMC Transportation revenue is for 2019.
Roadrunner Freight revenue is for 2019.
Dart Transit Co. revenue is estimated by SJ Consulting Group for 2020.
PGT Trucking revenue is for 2020.
Smith Transport revenue is for 2020.
* Tractor count includes company-owned, lease-to-own and owner-operator tractors.


UPS CEO Carol Tomé Outlines Challenging Year Ahead

UPS Inc. will pay out the biggest portion of its new labor pact over the next 12 months while trying to win back customers it lost during the contentious contract talks, CEO Carol Tomé said.
Estes Among Fleets to Pilot Remora’s Carbon Capture System

Estes was among the first commercial for-hire carriers to sign up to pilot emerging technology developed by Remora.
UPS to Raise Average Prices by 5.9%
UPS Inc. will raise prices 5.9%, to take effect on Dec. 26.
FAA Clears UPS Drones for Longer Flights

Two more companies including UPS have been granted approval to fly drones beyond the sight of ground operators in a key step that could eventually enable widespread package delivery.
Trimac Acquires Two More Carriers, Continues to Shop
Trimac Transportation Ltd. has purchased two North American bulk haulage carriers in the past few weeks, and has plans to accelerate its ongoing buying spree.
UPS Offers Buyouts to 167 Pilots as Air Cargo Slumps
UPS Inc. is offering a voluntary severance package for 167 pilots amid a slump in air freight volume.
Used Truck Market Can Likely Handle Yellow Liquidation
Used trucks and trailers owned by bankrupt Yellow Corp. are set to come up for auction in unprecedented numbers, but the market can handle it, say observers.
Flatbed and Cargo Safety Depends on Securement
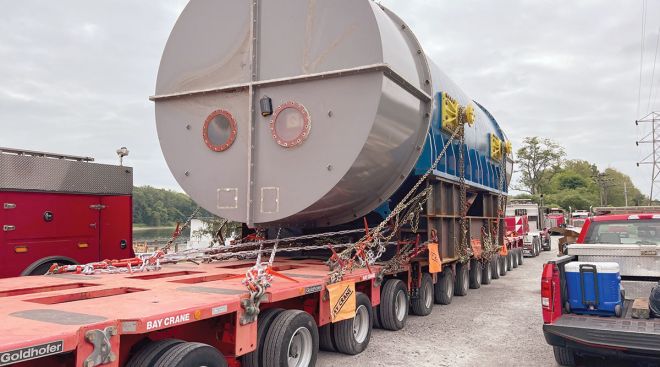
Making sure flatbed cargo is secured for transit goes beyond meeting applicable regulations, which cannot cover every contingency, experts contend.
Yellow’s Terminals: Analysts Expect More Bids
Analysts are expecting more players to take part in an upcoming auction for the 169 terminals owned by Yellow Corp. beyond those who already have raised their hands.
Yellow’s Shutdown Opens Up LTL Market for Competitors
The Yellow Corp. shutdown is having a downstream effect on the less-than-truckload space as freight volumes flow toward competitors.
-

2022
-
2021
-
2020
-
2019
-
2018
-
2017
-
2016
-
2015
-
2014
-
2013
-
2012
-
2011
-
2010
-
2009
-
2008
-
2007
-
2006
-
2005
-
2004


