


| Rank This Year | Rank Last Year | Company | Revenue (000) | Net Income (000) | Employees | Tractors* | Trailers |
|---|---|---|---|---|---|---|---|
| 96 | 99 | Groendyke Transport
|
273,125 est |
- | |||
| 99 | 98 | PGT Trucking
|
253,727 | - | 695 | 1,138 | 1,825 |
| 87 | 96 | Quantix Supply Chain Solutions
|
324,922 | -25,231 | 1,686 | 1,180 | 2,521 |
| 93 | 94 | Hansen & Adkins Auto Transport
|
283,137 est |
6,622 | 955 | 1,224 | 945 |
| 95 | 93 | Trans-System Inc.
|
274,000 | - | 1,036 | 1,004 | 1,833 |
| 64 | 92 | Heniff Transportation Systems
|
562,000 est |
- | 2,157 | 7,147 | |
| 89 | 91 | TransAm Trucking
|
297,000 est |
- | |||
| 90 | 90 | Dupré Logistics
|
294,058 | 6,464 | 1,125 | 770 | 1,700 |
| 81 | 89 | ContainerPort Group
|
350,000 | - | 408 | ||
| 77 | 88 | Fastfrate Group
|
400,000 | - | 2,800 | 1,152 | 1,622 |
| 92 | 87 | Melton Truck Lines
|
292,125 | - | 1,614 | 1,390 | 2,428 |
| 88 | 86 | RoadOne IntermodaLogistics
|
314,000 est |
- | 2,200 | 1,700 | 350 |
| 76 | 85 | Foodliner/Quest Liner
|
416,796 | - | 1,564 | 1,569 | 3,030 |
| 82 | 84 | Challenger Motor Freight
|
345,000 | - | 1,220 | 1,582 | 3,375 |
| 84 | 83 | John Christner Trucking
|
338,873 | - | 207 | 839 | 1,244 |
| 85 | 81 | Red Classic
|
332,458 | - | 1,296 | 655 | 3,362 |
| 72 | 80 | IMC Cos.
|
450,577 | - | 2,244 | ||
| 86 | 79 | Koch Cos.
|
328,936 | 3,028 | 1,045 | 973 | 5,652 |
| 78 | 78 | Mesilla Valley Transportation
|
399,317 | - | 1,970 | 2,015 | 5,800 |
| 79 | 76 | Maverick USA
|
389,182 est |
- | 2,125 | 1,582 | 2,582 |
| 44 | 75 | 10 Roads Express
|
851,957 est |
- | 3,500 | 5,000 | |
| 80 | 74 | Dart Transit Co.
|
377,600 est |
- | |||
| 73 | 73 | Roehl Transport
|
450,302 est |
- | 2,702 | 2,040 | 5,481 |
| 74 | 72 | TMC Transportation
|
450,000 est |
- | |||
| 50 | 71 | LaserShip Inc./OnTrac Inc.
|
725,000 est |
- | |||
| 69 | 70 | A. Duie Pyle Inc.
|
504,000 | - | 3,341 | 1,347 | 2,456 |
| 68 | 69 | Jack Cooper Holdings
|
507,000 est |
- | 3,753 | 1,424 | 1,434 |
| 71 | 68 | P.A.M. Transport
|
486,825 | 17,827 | 2,653 | 2,013 | 6,944 |
| 65 | 67 | USA Truck (DB Schenker)
|
551,138 | 4,746 | 2,032 | 2,065 | 6,263 |
| 67 | 66 | Two Men and a Truck Movers
|
524,929 est |
- | 11,396 | ||
| 63 | 65 | Cowan Systems
|
575,872 | - | 2,406 | 2,322 | 7,022 |
| 59 | 64 | Canada Cartage System
|
628,127 | - | 4,332 | 2,880 | 2,700 |
| 70 | 63 | Mercer Transportation Co.
|
495,272 | - | 266 | 2,234 | 2,234 |
| 66 | 62 | Hirschbach Motor Lines
|
532,531 | - | 1,282 | 1,786 | 3,415 |
| 56 | 60 | Heartland Express
|
645,262 | 70,806 | 3,780 | 2,630 | 8,000 |
| 61 | 59 | Suddath
|
600,000 est |
- | 2,200 | ||
| 61 | 58 | Trimac Transportation
|
600,000 | - | 3,100 | 2,500 | 2,900 |
| 47 | 57 | OnTrac Inc.
|
832,000 est |
- | |||
| 57 | 56 | Bison Transport
|
642,930 | - | 3,676 | 2,137 | 5,823 |
| 54 | 55 | Bennett International Group
|
693,196 | - | 1,031 | 3,285 | 2,186 |
| 60 | 54 | Mullen Group
|
601,288 | - | 3,539 | 2,042 | 5,079 |
| 55 | 53 | Dayton Freight Lines
|
669,000 | 83,000 | 4,949 | 1,761 | 4,695 |
| 51 | 52 | Western Express
|
721,500 | - | 3,416 | 3,000 | 7,900 |
| 52 | 51 | United Road Services
|
713,000 est |
- | 1,837 | 2,470 | 2,591 |
| 53 | 50 | AAA Cooper Transportation
|
702,000 | - | 4,500 | 2,679 | 7,474 |
| 58 | 49 | Stevens Transport
|
688,000 | 92,460 | 2,750 | 1,950 | 3,290 |
| 40 | 48 | PS Logistics
|
957,000 | - | 3,036 | 3,500 | 5,900 |
| 45 | 47 | Cardinal Logistics
|
849,000 | - | 4,250 | 3,012 | 8,007 |
| 42 | 46 | Marten Transport
|
874,374 | 69,500 | 4,140 | 3,331 | 5,395 |
| 48 | 45 | Pitt Ohio Transportation Group
|
828,407 | - | 5,697 | 2,028 | 5,871 |
| 43 | 44 | Central Transport International
|
871,000 est |
- | 3,580 | 8,675 | |
| 46 | 43 | Covenant Logistics Group
|
838,561 | -42,718 | 5,550 | 2,579 | 5,114 |
| 49 | 42 | Atlas World Group
|
806,000 | 8,000 | 637 | 994 | 3,803 |
| 41 | 41 | KLLM Transport Services
|
917,000 | - | 3,400 | 6,300 | |
| 35 | 40 | Ruan
|
1,222,782 | - | 5,500 | 3,413 | 9,468 |
| 39 | 39 | Lynden
|
960,000 | - | 2,595 | 877 | 2,428 |
| 38 | 38 | Quality Carriers
|
1,090,684 est |
- | |||
| 31 | 37 | Day & Ross
|
1,319,498 | - | 8,000 | 4,200 | 8,600 |
| 22 | 36 | Purolator
|
1,646,117 | - | 10,882 | 462 | 1,649 |
| 37 | 35 | Crete Carrier Corp.
|
1,171,000 est |
- | 6,500 | ||
| 27 | 34 | Evans Delivery
|
1,426,000 | - | 536 | 7,500 | |
| 32 | 33 | Anderson Trucking Service
|
1,274,709 | - | 2,369 | 2,706 | 7,209 |
| 36 | 32 | Averitt Express
|
1,207,587 | - | 8,550 | 4,488 | 14,495 |
| 34 | 31 | Southeastern Freight Lines
|
1,256,333 | - | 8,252 | 2,847 | 7,886 |
| 28 | 30 | Sirva Inc.
|
1,400,000 est |
- | |||
| 33 | 29 | Forward Air
|
1,269,573 | 52,767 | 3,774 | 799 | 6,009 |
| 30 | 28 | UniGroup
|
1,320,000 | - | 850 | 4,500 | 2,575 |
| 29 | 27 | Universal Logistics Holdings
|
1,391,083 | 48,132 | 7,420 | 4,798 | 3,843 |
| 25 | 26 | C.R. England
|
1,466,947 | - | 7,150 | 4,000 | 6,600 |
| 24 | 25 | CRST The Transportation Solution
|
1,502,737 | - | 6,631 | 4,704 | 13,994 |
| 21 | 24 | U.S. Xpress Enterprises
|
1,742,101 | 17,632 | 7,998 | 6,500 | 13,000 |
| 26 | 23 | Daseke Inc.
|
1,454,100 | 6,200 | 4,304 | 5,052 | 11,579 |
| 23 | 22 | Kenan Advantage Group
|
1,572,138 | - | 8,600 | 6,854 | 12,283 |
| 20 | 21 | Saia Inc.
|
1,822,366 | 138,340 | 10,600 | 5,700 | 17,400 |
| 75 | 20 | Roadrunner Freight
|
430,000 est |
- | 893 | 1,201 | |
| 19 | 19 | R+L Carriers
|
1,973,000 est |
- | |||
| 16 | 18 | NFI
|
2,630,000 | - | 14,500 | 4,500 | 12,500 |
| 18 | 17 | Prime Inc.
|
2,208,764 | 326,543 | 4,839 | 7,199 | 14,162 |
| 17 | 16 | Werner Enterprises
|
2,372,178 | 169,078 | 12,292 | 7,861 | 24,400 |
| 14 | 15 | Penske Logistics
|
3,200,000 | - | 19,954 | 6,674 | 21,961 |
| 15 | 14 | ArcBest
|
2,940,163 | 71,100 | 13,000 | 4,136 | 22,776 |
| 12 | 13 | Estes Express Lines
|
3,559,000 | - | 19,000 | 8,043 | 32,656 |
| 13 | 12 | Hub Group
|
3,495,644 | 73,559 | 5,000 | 3,600 | 4,800 |
| 5 | 11 | TFI International
|
6,347,134 | 275,675 | 16,753 | 24,604 | 49,713 |
| 11 | 10 | Ryder Supply Chain Solutions
|
3,773,800 | 233,382 | 73,300 | 43,300 | |
| 9 | 9 | Landstar System
|
4,132,981 | 192,106 | 1,320 | 10,991 | 17,061 |
| 10 | 8 | Old Dominion Freight Line
|
4,015,129 | 672,682 | 19,779 | 9,288 | 36,650 |
| 6 | 7 | Knight-Swift Transportation Holdings
|
4,673,863 | 410,002 | 22,900 | 19,025 | 57,722 |
| 7 | 5 | Schneider
|
4,552,800 | 211,700 | 15,225 | 9,000 | 36,900 |
| 8 | 5 | Yellow Corp.
|
4,513,700 | -53,500 | 30,000 | 13,500 | 41,900 |
| 4 | 4 | J.B. Hunt Transport Services
|
9,640,000 | 506,035 | 30,364 | 17,777 | 35,857 |
| 3 | 3 | XPO
|
16,252,000 | 79,000 | 102,000 | 15,500 | 40,000 |
| 2 | 2 | FedEx Corp.
|
78,752,000 | 3,029,000 | 500,000 | 36,598 | 132,540 |
| 1 | 1 | UPS Inc.
|
84,628,000 | 1,343,000 | 543,000 | 15,719 | 87,954 |
| 97 | United Vision Logistics
|
261,000 est |
- | ||||
| 98 | Central Freight Lines
|
256,000 est |
- | ||||
| 83 | R&R Express
|
343,110 | - | 291 | 504 | 642 | |
| 100 | Smith Transport
|
246,000 | - | 1,136 | 816 | 2,250 | |
| 91 | Postal Fleet Services
|
292,568 | - | ||||
| 94 | Daylight Transport
|
275,000 | - |
Top For-Hire Carriers on this list are common and contract freight carriers operating in the United States, Canada and Mexico. Companies are ranked on the basis of annual revenue. To be included in the Top 100 or any of the sectors, please send contact information to tteditor@ttnews.com. We will contact you via phone or e-mail to get information about your company prior to publication of the next Top 100 list.
* Tractor count includes company-owned, lease-to-own and owner-operator tractors.
Revenues for the following carriers are estimated by SJ Consulting Group: R+L Carriers, Crete Carrier Corp., Central Transport International, OnTrac Inc., LaserShip Inc., Jack Cooper Holdings, Roehl Transport, Dart Transit Co.
^ Stevens Transport revenue and net income figures updated after publication of 2021 ranking.
On the Bubble


Knight-Swift Reports 69% Earnings Drop in Q3
Knight-Swift Transportation Holdings Inc. on Oct. 19 reported that its third-quarter earnings dropped by 69% year-over-year, even as revenue increased.
Mullen Group Reports Mixed Q3 Results
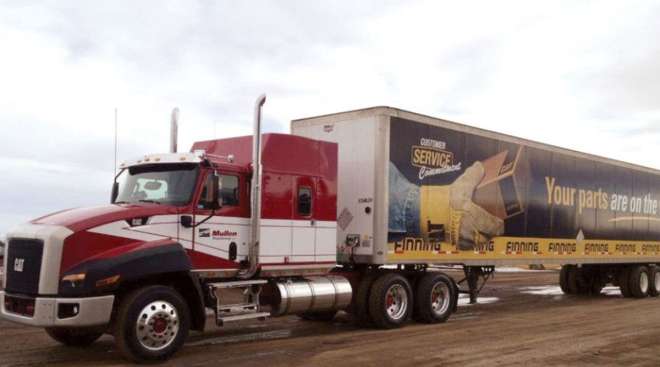
Mullen Group posted an increase in earnings despite a decline in overall revenue during the third quarter, the company reported Oct. 19.
Marten Revenue Nears $280 Million Amid Tough Q3 Market
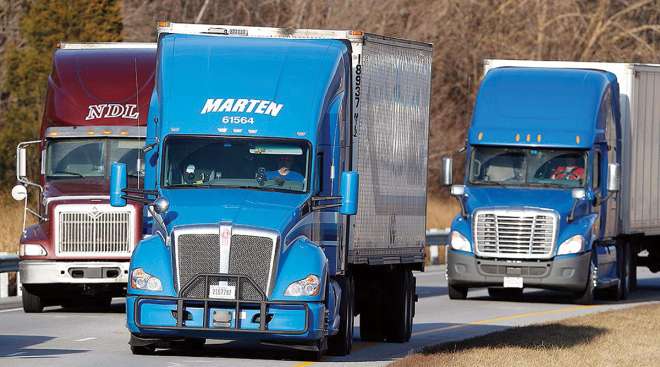
Marten Transport experienced a decline in revenue and earnings amid tough market conditions during the third quarter, the company reported Oct 18.
Autonomous Trucks Could Create Safer Roads, Better Jobs

AUSTIN, Texas — Autonomous truck developers and their industry partners see opportunities for this technology to improve road safety and create more desirable jobs for drivers.
Yellow Aims to Appoint Auction Houses for Rolling Stock Sale
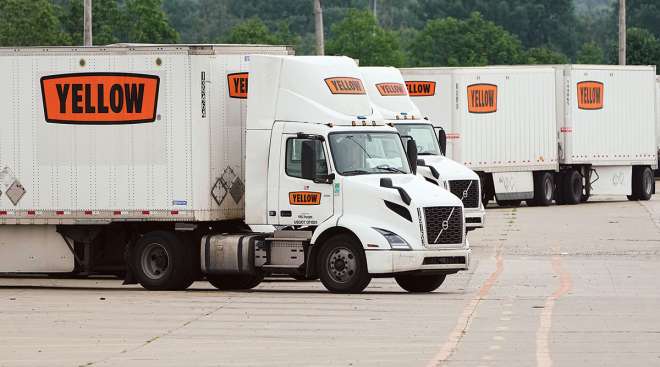
The administrators of Yellow Corp. aim to use auction houses to sell off the bankrupt less-than-truckload carrier’s rolling stock, according to court filings.
J.B. Hunt Q3 Profit Slides 30.4% Year-Over-Year

J.B. Hunt Transport Services posted a 30.4% year-over-year decrease in profits in the third quarter, undershooting analyst expectations as revenues declined at each of the carrier’s operating units.
Yellow Extends Bid Deadline for Trucks, Trailers
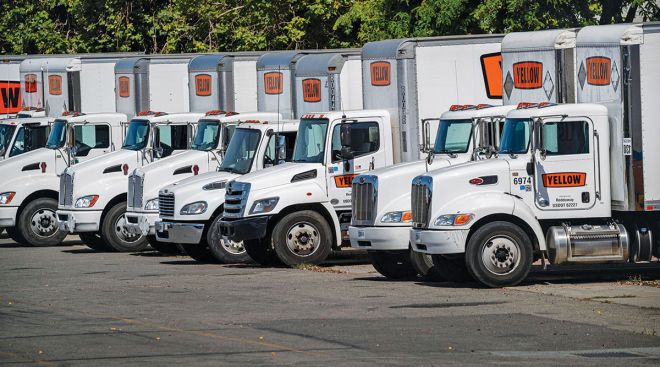
Yellow Corp. has rescheduled the bid deadline for its fleet of trucks and trailers, according to court documents related to the shuttered carrier’s ongoing bankruptcy proceedings.
Estes Rating, Quoting System Returns to Action After Cyberattack
Estes Express Lines late Oct. 12 said its rating and quoting system, as well as telephone lines and email access, were again operational following a cyberattack earlier in the month.
Mercedes Unveils Longhaul Electric Truck
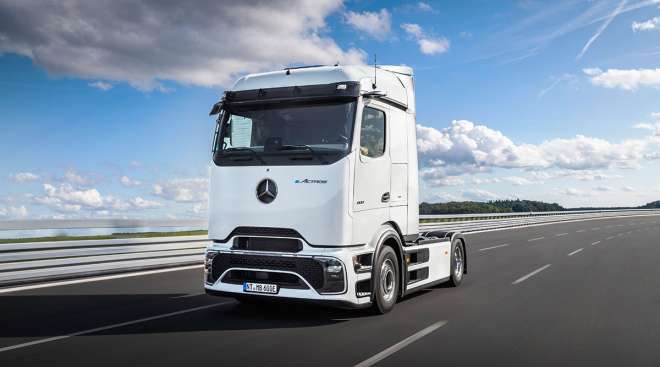
Mercedes-Benz Trucks revealed a heavy-duty electric truck to take on Tesla Inc.’s battery-powered Semi, the latest move in the intensifying race to decarbonize road logistics.
Estes: Many Core IT Systems Operational Again After Attack
Estes Express Lines on Oct. 6 said a large share of its core IT infrastructure systems were “once again operational” following a cyberattack earlier in the week.
-

2022
-
2021
-
2020
-
2019
-
2018
-
2017
-
2016
-
2015
-
2014
-
2013
-
2012
-
2011
-
2010
-
2009
-
2008
-
2007
-
2006
-
2005
-
2004


