


2017 Essential Financial and Operating Information for the 100 largest For-Hire Carriers in North America
Up Front

Rankings
| Rank This Year | Rank Last Year | Company | Revenue (000) | Net Income (000) | Employees | Tractors* | Trailers |
|---|---|---|---|---|---|---|---|
| 1 | 1 | UPS Inc.
|
60,906,000 | 3,431,000 | 434,000 | - | - |
| 2 | 2 | FedEx Corp.
|
57,570,000 | 1,907,000 | 400,000 | 29,733 |
108,041 |
| 3 | 3 | XPO
|
14,619,400 | 63,100 | 89,000 | 15,396 |
27,606 |
| 4 | 4 | J.B. Hunt Transport Services
|
6,555,459 | 432,090 | 22,172 | 14,805 |
30,330 |
| 5 | 5 | Yellow Corp.
|
4,697,500 | 21,500 | 32,000 | 14,300 |
44,500 |
| 6 | 7 | Schneider
|
4,045,736 | 156,851 | 19,300 | 10,459 |
37,910 |
| 7 | 6 | Swift Transportation
|
4,031,517 | 149,267 | 21,900 | 18,366 |
64,066 |
| 8 | 8 | Hub Group
|
3,572,790 | 74,805 | 2,755 | 2,705 |
436 |
| 9 | 9 | Landstar System
|
3,167,634 | 137,350 | 1,197 | 9,186 |
15,170 |
| 10 | 10 | TFI International
|
3,037,205 | 482,592 | 17,685 | 18,535 |
25,310 |
| 11 | 11 | Old Dominion Freight Line
|
2,991,517 | 295,765 | 19,040 | 7,994 |
32,525 |
| 12 | 12 | ArcBest
|
2,700,219 | 18,652 | 13,000 | 4,387 |
21,361 |
| 13 | 13 | Ryder System
|
2,658,745 | 169,172 | - | 67,900 |
42,800 |
| 14 | 14 | Estes Express Lines
|
2,400,000 | - | 16,570 | 7,009 |
26,718 |
| 15 | 16 | Roadrunner Freight
|
2,044,000 | - | 4,645 | 4,332 |
6,508 |
| 16 | 15 | Werner Enterprises
|
2,008,991 | 79,129 | 11,738 | 7,100 |
24,350 |
| 17 | 17 | UniGroup
|
1,700,000 | - | - | - | - |
| 18 | 18 | Prime Inc.
|
1,683,834 | 194,247 | 3,661 | 6,246 |
12,309 |
| 19 | 24 | CRST The Transportation Solution
|
1,546,000 | - | 7,849 | 6,682 |
13,811 |
| 20 | 26 | Purolator
|
1,526,207 | - | 10,000 | 463 |
1,280 |
| 21 | 23 | Penske Logistics
|
1,500,000 | - | 14,180 | 2,704 |
8,785 |
| 21 | 20 | Sirva
|
1,400,000 | - | - | - | - |
| 21 | 19 | U.S. Xpress Enterprises
|
1,500,000 | - | 10,135 | 7,000 |
15,500 |
| 24 | - | R+L Carriers
|
1,452,000 | - | 10,000 | 5,958 |
12,604 |
| 25 | 21 | Kenan Advantage Group
|
1,421,975 | - | 7,561 | 6,869 |
10,404 |
| 26 | 23 | C.R. England
|
1,304,898 | - | 7,883 | 4,165 |
5,990 |
| 27 | 27 | NFI
|
1,250,000 | - | 8,300 | 2,793 |
8,300 |
| 28 | 25 | Saia Inc.
|
1,218,481 | 48,024 | 9,000 | 4,000 |
13,000 |
| 29 | 28 | Southeastern Freight Lines
|
1,192,296 | - | 8,458 | 3,734 |
11,943 |
| 30 | 29 | Knight-Swift Transportation Holdings
|
1,118,034 | 93,863 | 5,500 | 4,705 |
9,915 |
| 31 | 32 | Averitt Express
|
1,091,475 | - | - | 4,500 |
14,623 |
| 32 | 30 | Universal Logistics Holdings
|
1,072,751 | 24,244 | 6,275 | 3,801 |
4,154 |
| 33 | 32 | Celadon Group Inc.
|
1,050,000 | 2,700 | 6,000 | 7,050 |
15,000 |
| 34 | 37 | Anderson Trucking Service
|
1,032,144 | - | 1,410 | 2,372 |
6,300 |
| 35 | 33 | Crete Carrier
|
1,030,000 | - | 5,500 | 5,130 |
12,883 |
| 36 | - | Cardinal Logistics
|
1,000,600 | - | 4,642 | 3,020 |
9,725 |
| 37 | 35 | Forward Air
|
982,530 | 27,670 | 3,689 | 935 |
4,868 |
| 38 | 36 | KLLM Transport Services
|
937,000 | - | - | 3,815 |
5,300 |
| 39 | 34 | Lynden Inc.
|
925,000 | - | 2,800 | 768 |
2,889 |
| 40 | 38 | Ruan Transportation Management Systems
|
872,184 | - | 5,546 | 3,425 |
8,165 |
| 41 | 39 | Atlas World Group
|
795,239 | - | - | 2,159 |
- |
| 42 | 46 | Daseke Inc. (TFI)
|
770,000 | -8,700 | 3,400 | 3,500 |
7,300 |
| 43 | 42 | Quality Carriers
|
758,000 | - | - | - | - |
| 44 | 113 | Central Transport
|
703,000 | - | - | 3,180 |
6,543 |
| 45 | 42 | Trimac Transportation
|
700,000 | - | 3,400 | 1,800 |
2,400 |
| 46 | 47 | Marten Transport
|
671,144 | 33,464 | 3,622 | 2,848 |
4,854 |
| 47 | 43 | Covenant Logistics
|
670,651 | 16,835 | 4,400 | 2,535 |
7,389 |
| 48 | 44 | Jack Cooper Holdings
|
667,849 | - | - | 2,119 |
2,126 |
| 49 | 46 | Stevens Transport
|
662,450 | 77,990 | 2,703 | 2,690 |
3,795 |
| 50 | 52 | Pitt Ohio Transportation Group
|
649,972 | - | 3,178 | 866 |
2,072 |
| 51 | 45 | Day & Ross
|
640,515 | - | 1,829 | 1,531 |
4,010 |
| 52 | 41 | Heartland Express
|
612,937 | 56,386 | 3,600 | 5,049 |
15,218 |
| 53 | 54 | AAA Cooper Transportation
|
605,538 | - | 4,600 | 2,400 |
6,000 |
| 54 | 49 | Suddath
|
550,000 | - | - | - | - |
| 55 | 52 | Western Express
|
527,909 | 38,334 | 3,000 | 2,582 |
7,366 |
| 56 | - | OnTrac Inc.
|
525,000 | - | 3,000 | 55 |
571 |
| 56 | 54 | United Road Services
|
525,000 | - | 1,700 | 1,835 |
1,200 |
| 58 | 51 | Mullen Group
|
520,272 | - | 3,267 | 1,821 |
4,998 |
| 59 | 59 | Evans Network of Cos.
|
505,000 | - | 320 | 3,865 |
650 |
| 60 | 58 | Dayton Freight Lines
|
498,370 | - | 4,010 | 1,387 |
3,664 |
| 61 | 58 | PS Logistics
|
495,300 | - | 2,600 | 2,247 |
2,359 |
| 62 | 57 | Canada Cartage
|
452,728 | - | 3,110 | 2,429 |
2,736 |
| 63 | 55 | Mercer Transportation
|
449,337 | - | 295 | 2,228 |
2,400 |
| 64 | 69 | Dart Transit Co.
|
441,845 | - | 1,273 | 2,187 |
6,963 |
| 65 | 63 | California Cartage Co.
|
440,000 | - | 1,500 | - | - |
| 66 | 60 | Shevell Group
|
436,000 | - | 3,895 | 1,550 |
3,902 |
| 67 | 62 | Cowan Systems
|
434,018 | - | 1,915 | 2,059 |
5,111 |
| 68 | 66 | PAMT Corp.
|
432,852 | 11,101 | 2,463 | - | 5,699 |
| 69 | 68 | Bennett Family of Cos.
|
429,616 | - | 998 | 1,338 |
1,892 |
| 70 | 53 | USA Truck
|
429,099 | -7,699 | 2,000 | 1,415 |
5,605 |
| 71 | 61 | TransX Group of Companies
|
423,678 | - | 2,617 | 1,560 |
4,410 |
| 72 | 66 | Mesilla Valley Transportation
|
402,940 | - | 1,900 | 1,400 |
5,100 |
| 73 | - | TMC Transportation
|
394,000 | - | - | - | - |
| 74 | 65 | Bison Transport
|
432,084 | - | 2,559 | 1,439 |
4,475 |
| 75 | 70 | Interstate Distributor Co.
|
370,168 | - | 2,000 | 1,805 |
3,900 |
| 76 | 70 | Roehl Transport
|
355,323 | - | 2,485 | 1,995 |
4,898 |
| 77 | 96 | Central Freight Lines
|
347,800 | - | - | 1,127 |
7,852 |
| 78 | 79 | A. Duie Pyle
|
346,000 | - | 2,800 | 945 |
2,225 |
| 79 | 78 | Black Horse Carriers
|
337,500 | - | 2,625 | 1,520 |
3,000 |
| 80 | 74 | Maverick Transportation
|
334,953 | - | 2,119 | 1,675 |
2,453 |
| 81 | 71 | Epes Carriers Inc.
|
332,073 | 24,333 | 1,535 | 1,202 |
- |
| 82 | 75 | Dicom Transportation Group
|
320,700 | - | - | - | - |
| 83 | 74 | Cassens Transport
|
317,557 | - | 1,419 | 1,364 |
1,364 |
| 84 | 80 | IMC Logistics
|
293,000 | - | 1,875 | 1,515 |
91 |
| 85 | 76 | Koch Cos.
|
280,000 | - | 1,150 | 1,001 |
5,250 |
| 86 | - | Dependable Supply Chain Services
|
278,000 | - | - | 321 |
1,220 |
| 87 | 91 | Transport Investments
|
276,000 | - | 200 | 1,150 |
2,100 |
| 88 | - | TransAm Trucking
|
270,000 | - | - | 1,144 |
1,818 |
| 89 | 82 | Challenger Motor Freight
|
258,006 | - | - | - | - |
| 90 | 83 | Trans-System
|
252,500 | - | 1,100 | 1,021 |
1,600 |
| 91 | 84 | Foodliner/Quest Liner
|
252,275 | - | 1,261 | 1,173 |
2,185 |
| 92 | - | Hirschbach Motor Lines
|
251,697 | - | 646 | 1,010 |
- |
| 93 | - | United Vision Logistics
|
245,000 | - | - | 1,003 |
1,347 |
| 94 | - | Salmon Cos.
|
241,796 | - | - | 713 |
1,092 |
| 95 | 79 | Comcar Industries
|
240,054 | - | - | 1,592 |
4,660 |
| 96 | 86 | John Christner Trucking
|
239,015 | 14,998 | 232 | 844 |
1,060 |
| 97 | 89 | Martin Transportation Systems
|
237,500 | - | 1,637 | 1,130 |
2,200 |
| 98 | 81 | Paschall Truck Lines
|
237,311 | - | 1,872 | 1,303 |
3,101 |
| 99 | 87 | Superior Bulk Logistics
|
233,900 | 5,200 | 1,392 | 1,300 |
2,100 |
| 100 | 94 | Quantix SCS
|
229,258 | - | 1,100 | 900 |
1,200 |
Top For-Hire Carriers on this list are common and contract freight carriers operating in the United States, Canada and Mexico. Companies are ranked on the basis of annual revenue. To be included in the Top 100 or any of the sectors, please send contact information to tteditor@ttnews.com. We will contact you via phone or email to get information about your company prior to publication of the next Top 100 list.
* Tractor count includes company-operated, lease-to-own and owner-operator tractors.
Extras

On the Bubble

For-Hire News
Elections change Congress, but they don’t change trucking’s priorities

Cargo theft does not have a party affiliation, notes ATA's Henry Hanscom. Neither do deteriorating roads and bridges, safety compliance or the shortage of truck parking.
November 4, 2026What the midterms could mean for trucking

The results of Election Day 2026 may completely change how transportation policy is decided.
November 3, 2026Schneider shifts eastern intermodal freight to Norfolk Southern
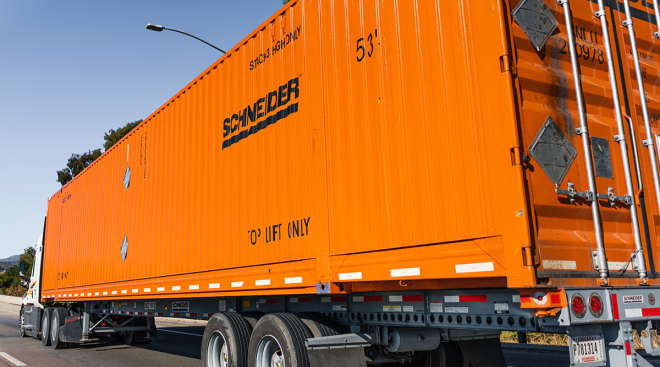
Schneider unveiled a deal making Norfolk Southern its primary eastern rail provider Oct. 29, demonstrating the size of the carrier’s intermodal ambitions.
November 3, 2026More states halt non-domiciled CDL programs

Louisiana and Wyoming have ceased issuing non-domiciled commercial driver licenses, while Ohio is ending its program and downgrading credentials.
November 2, 2026Heniff to develop Ohio terminal for Cargill
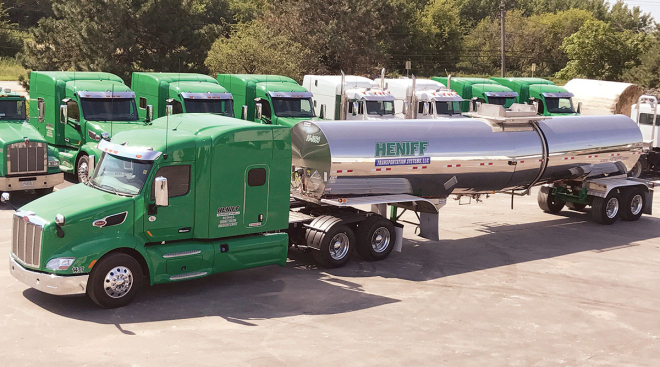
Heniff Transportation Systems will develop a sweetener transload facility in Ohio dedicated to serving Cargill and its customers, Heniff announced Nov. 2.
November 2, 2026Trucking awaits Congress’ next move on highway funds
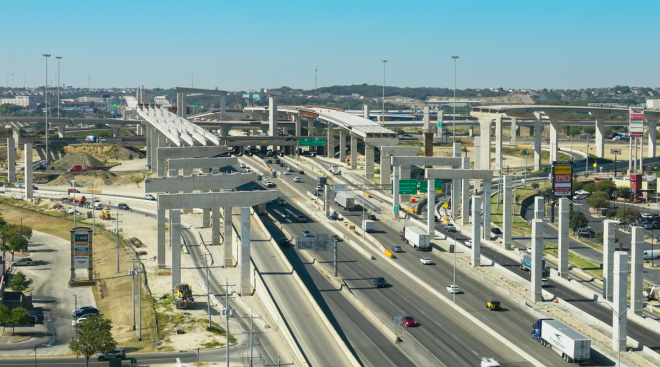
The $36.8 billion funding lapse affects road, safety and bridge projects across the country as states and localities try to plan ahead.
November 2, 2026TFI’s Bédard bemoans ‘broken record’ of disappointment in LTL
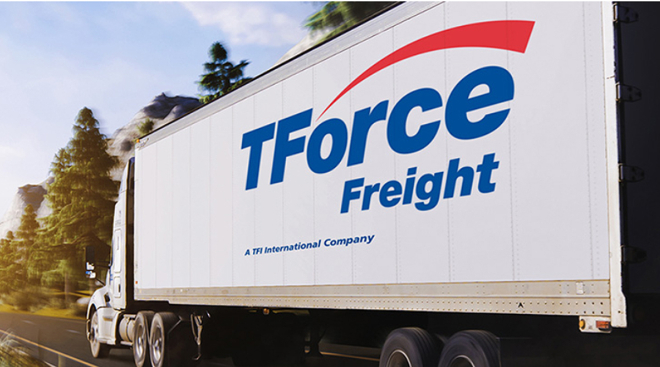
Longtime Chairman and CEO Alain Bédard told analysts and investors during TFI’s third-quarter 2026 earnings call that the carrier plans to raid its peers for manager replacements.
November 2, 2026FedEx Freight goes hunting after initial consolidation

The company’s revenue was $2.442 billion in the three months that ended Sept. 30, an increase of 8.1% compared with $2.259 billion in the same period a year earlier.
October 30, 2026XPO’s higher Q3 volume, profit powered by SMB, grocery wins

Greenwich, Conn.-based XPO benefited from improved freight market conditions and customer service, the executives told analysts and investors.
October 30, 2026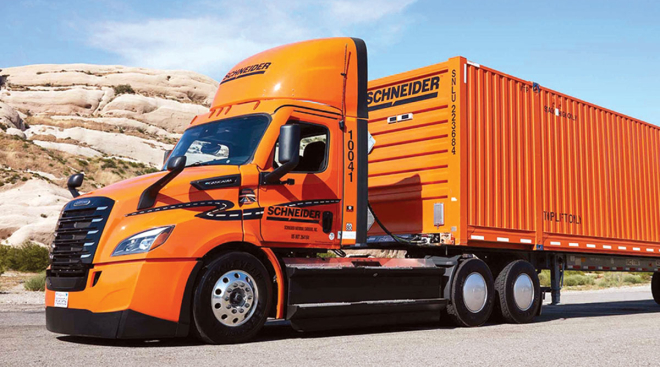
Archives
-

2025
-
2024
-
2023
-
2022
-
2021
-
2020
-
2019
-
2018
-
2017
-
2016
-
2015
-
2014
-
2013
-
2012
-
2011
-
2010
-
2009
-
2008
-
2007
-
2006
-
2005
-
2004