Class 8 Sales Surpass 22,000 in March

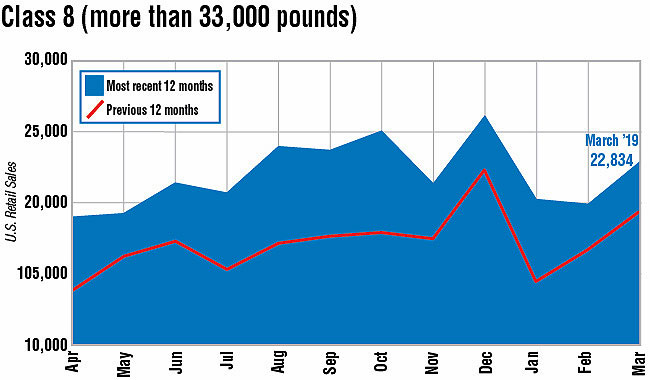
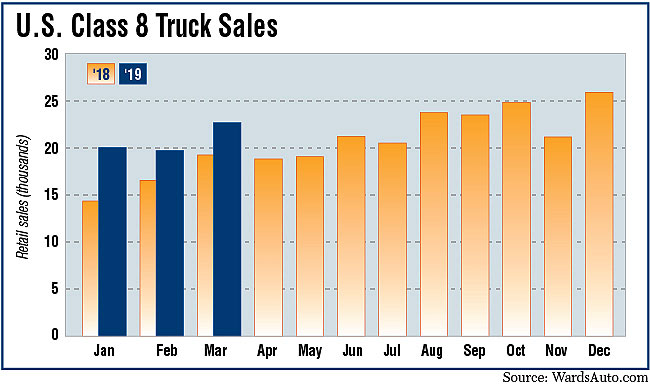
U.S. Class 8 retail sales in March climbed above 22,000 for the first time this year, WardsAuto.com reported. All truck makers but one notched gains.
The sales total of 22,834 was 17.8% higher compared with 19,384 a year earlier, according to Ward’s.
For some analysts, March’s volume brought a sigh of relief.
“I would honestly love to get really excited about it. The reality is, it is about time. We have been waiting on this for awhile,” Steve Tam, vice president of ACT Research, told Transport Topics.
Don Ake, vice president of commercial vehicles for FTR, agreed.
“We were waiting for a number like this to show the strength was actually happening, that trucks were getting into service — despite the moderating economic news and all the noise,” Ake said.
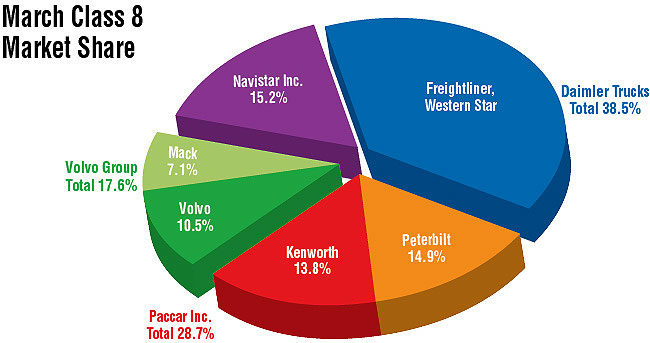
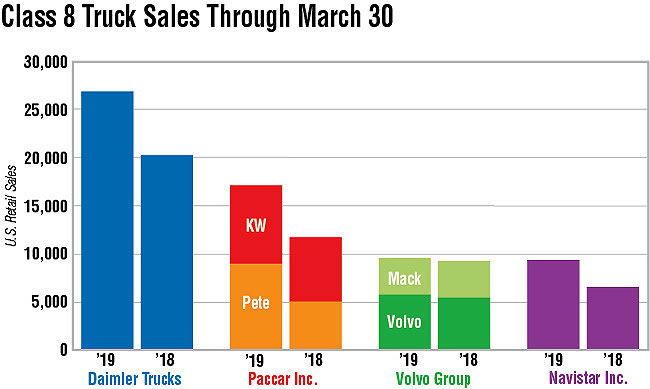
Freightliner remained the leader with a 36.6% market share on sales of 8,363 units, an increase of 11.4% from a year earlier. Freightliner is a brand of Daimler Trucks North America.
DTNA’s Western Star brand earned a 1.8% share with 418 sales, down 6.7% from a year earlier.
International Truck, a unit of Navistar Inc., posted the biggest monthly increase, rising 62.2% from a year earlier on sales of 3,476 trucks. That was good for a 15.2% share, which was the second highest of all the individual brands.
“We feel we are in a stable position from a product standpoint, where we can sell what’s new, and are not trying to transition out of outgoing products. It is a great time to be in this situation,” said Steve Gilligan, Navistar’s vice president of product marketing.
Another analyst said production capacity is going to be an issue for the entire year.
“What we saw in 2018 was a market where everybody was selling every truck they could make. I think 2019 will be like 2018. The question is, can they make more this year,” said economist Bob Dieli, an associate at McKay & Co.
Dieli likened the possibility of slower growth in the 2019 market to a car’s accelerator. “Just because you take your foot off the accelerator, doesn’t mean you’ve stopped moving.”
Mack Trucks saw sales rise 18.6% compared with a year earlier to 1,623, which was good for a 7.1% share.
Jonathan Randall, Mack senior vice president of North American sales, said, “Considerable order backlog will translate into retail sales momentum. We also continue to see strong demand for Mack’s products and solutions that help reduce customers’ total cost of ownership by boosting efficiency and productivity while also maximizing uptime.”
Volvo Trucks North America posted a 10% gain in sales on 2,404 trucks, good for a 10.5% share.
VTNA and Mack are units of Volvo Group.
Peterbilt Motors Co. posted a 14.9% share on sales of 3,403. That was up 20.5% compared with a year earlier.
Kenworth Truck Co. saw sales rise 8.2% to 3,147 and claimed a 13.8% share.
Paccar Inc. is the parent company of the Peterbilt and Kenworth brands.
Across the industry, year-to-date Class 8 sales rose to 62,884 compared with 50,529. That was a 24.5% increase and underscores 2018 got off to a slow start and so early comparables are easier. Last year was strong from June on.
Analysts expect the opposite this year: a strong start in the first half and a slower second half.
Holding on to that 25% gain for the full year is uncertain and “largely constrained by industry’s ability to produce and deliver,” Tam said.
ACT forecasts U.S. retail sales will reach 264,000 in 2019. That compares with Ward’s total of 250,545 a year ago. But ACT includes about 5,000 worth of volume that Ward’s doesn’t count, “some of the specialty vehicles — dump, cement and refuse trucks,” Tam said.
American Trucking Associations Chief Economist Bob Costello noted that truckload carriers, in terms of trucks on hand, are in nearly the same position as 2018.
“Through February, total truckload tractor counts at for-hire fleets, which includes both company tractors and independent contractor equipment, were down nearly 1% from the end of 2018. However, counts were up about 3% on a year-over-year basis on easy comparisons as the truckload sector saw a reduction in tractor counts early last year, too,” he said.
But other indicators are changing, he said.
“I’m growing increasingly concerned that there is a glut of inventories throughout the supply chain that will, and probably already has, hurt truck freight volumes,” Costello said.
The total business inventories/sales ratio based on seasonally adjusted data at the end of January was 1.39. The January 2018 ratio was 1.36, according to the U.S. Census Bureau, citing the latest available data.
Costello previously has said the optimal range is 1.30 to 1.35 — or about what it was in late 2014.