


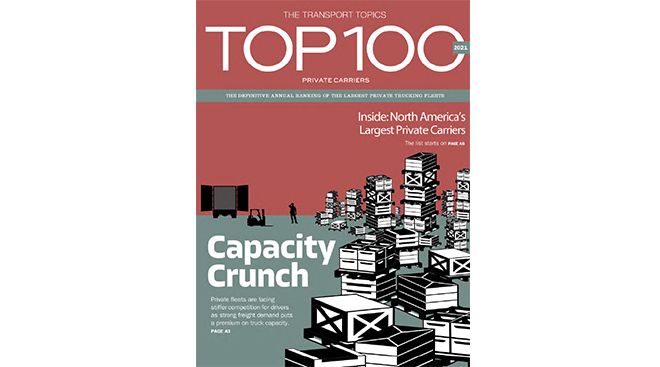
Top 100 Private | Food Service | Grocery | Beverage | Petroleum/Chemical | Industrial Gases | Agriculture/Food Processing | Wholesale/Retail | Manufacturing
Equipment Rental | Building Materials | Waste Management | Paper/Office Products | Construction | Health Care | Uniform Rental | Media & Entertainment
| Rank This Year | Rank Last Year | Company | Tractors | Trucks | Pickups/ Cargo Vans | Trailers | Annual Revenue |
|---|---|---|---|---|---|---|---|
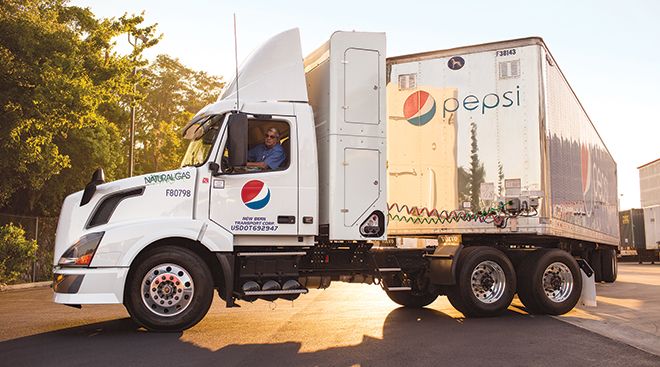
| 1 | 1 | PepsiCo Inc. |
10,870 | 4,658 | 16,137 | 19,430 | $70.4 billion |
| 2 | 2 | Sysco Corp. |
8,745 | 1,345 | 840 | 10,593 | $52.9 billion |
| 3 | 3 | Walmart Inc. |
7,400 | 25 | - | 58,826 | $559.2 billion |
| 4 | 4 | Halliburton Co. |
5,677 | 2,793 | - | 11,136 | $14.4 billion |
| 5 | 5 | US Foods |
5,426 | 375 | - | 7,096 | $22.9 billion |
| 6 | 6 | Reyes Holdings |
5,104 | 826 | 1,249 | 6,846 | $29.0 billion |
| 7 | 7 | Performance Food Group |
4,767 | 508 | - | 6,091 | $25.1 billion |
| 8 | 8 | McLane Co. |
3,852 | 109 | 31 | 5,833 | $46.8 billion |
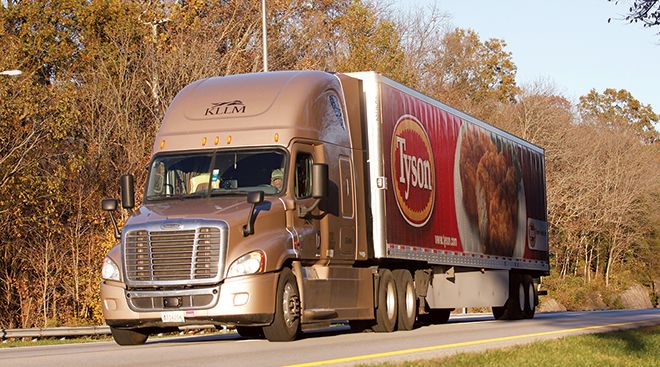
| 9 | 11 | Tyson Foods |
2,594 | 46 | - | 5,024 | $43.2 billion |
| 10 | 25 | Helena Agri-Enterprises |
2,552 | 1,792 | - | 2,670 | - |
| 11 | 10 | NexTier Oilfield Solutions |
2,436 | 424 | - | 3,373 | $1.2 billion |
| 12 | 13 | Basic Energy Services |
2,218 | 642 | - | 1,880 | $0.4 billion |
| 13 | 9 | Schlumberger Limited |
2,101 | 363 | - | 5,582 | $23.6 billion |
| 14 | 12 | United Rentals |
2,047 | 3,730 | - | 2,361 | $8.5 billion |
| 15 | 14 | Gordon Food Service |
1,875 | 16 | - | 2,695 | $14.0 billion |
| 16 | 19 | Coca-Cola Bottling Co. United |
1,595 | 554 | - | 1,854 | - |
| 17 | 18 | American Air Liquide Holdings |
1,586 | 3,858 | - | 2,203 | $23.4 billion |
| 18 | 17 | Dot Foods |
1,568 | 10 | 40 | 2,645 | - |
| 19 | 20 | United Natural Foods Inc. (UNFI) |
1,548 | 6 | - | 4,701 | $26.5 billion |
| 20 | 16 | Sunbelt Rentals |
1,537 | 3,517 | - | 1,507 | $5.4 billion |
| 21 | 15 | CHS Inc. |
1,534 | 1,868 | - | 5,746 | $28.4 billion |
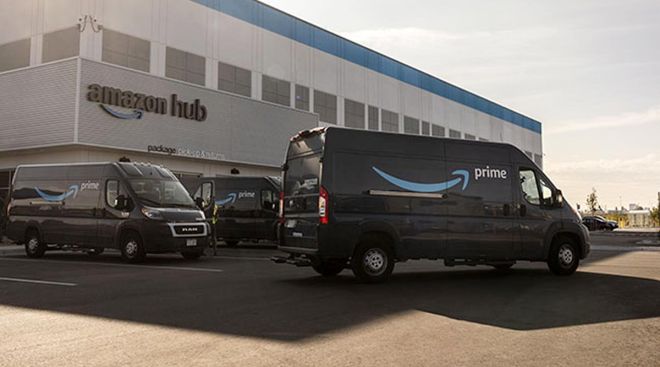
| 22 | Amazon.com Inc. |
1,395 | 12,373 | - | 37,390 | $386.1 billion |
|
| 23 | 22 | The Quikrete Cos. |
1,348 | 5 | - | 2,051 | - |
| 24 | 23 | Pilot Co. |
1,341 | 28 | - | 1,688 | - |
| 25 | 27 | Cemex USA |
1,229 | 3,597 | - | 2,257 | $6.8 billion |
| 26 | 36 | Ashley Furniture Industries |
1,215 | 78 | 6 | 4,040 | - |
| 27 | 30 | Clean Harbors |
1,172 | 4,444 | - | 3,915 | $3.1 billion |
| 28 | 28 | ProPetro Holding Corp. |
1,156 | 32 | - | 1,662 | $0.8 billion |
| 29 | 29 | Ahold USA/Delhaize America |
1,149 | 724 | - | 4,577 | $51.8 billion |
| 30 | 24 | Cudd Energy Services |
1,126 | 291 | - | 1,399 | - |
| 31 | 58 | Prairie Farms Dairy |
1,120 | 1,649 | 318 | 3,671 | - |
| 32 | 32 | Core-Mark Holding Co. |
1,099 | 137 | - | 1,315 | $17.0 billion |
| 33 | 31 | Ben E. Keith Co. |
1,094 | 73 | - | 1,348 | - |
| 34 | 33 | FTS International |
1,083 | 74 | - | 1,343 | $0.3 billion |
| 35 | 46 | Energy Transfer Partners |
1,075 | 101 | - | 1,289 | $39.0 billion |
| 36 | 37 | Love's Travel Stops & Country Stores |
1,064 | - | - | 876 | - |
| 37 | 49 | Medline Inc. |
973 | 348 | - | 1,279 | $13.9 billion |
| 38 | 38 | Walgreen Co. |
959 | 23 | - | 2,595 | $139.5 billion |
| 39 | 35 | Albertsons Cos. |
948 | - | - | 3,309 | $69.7 billion |
| 40 | 39 | The Kroger Co. |
943 | 15 | - | 14,078 | $132.5 billion |
| 41 | 40 | CRH Americas |
930 | 1,745 | - | 2,338 | $11.3 billion |
| 42 | 42 | Maxim Crane Works |
882 | 641 | - | 1,818 | - |
| 43 | 43 | Sherwin-Williams Co. |
861 | 1 | - | 2,119 | $18.4 billion |
| 44 | 44 | Swire Coca-Cola USA |
853 | 278 | - | 1,172 | $2.3 billion |
| 45 | 45 | BlueLinx Holdings |
836 | 44 | - | 848 | $3.1 billion |
| 46 | 52 | ABC Supply Co. |
820 | 3,050 | - | 1,150 | $12.1 billion |
| 46 | 48 | Darling Ingredients |
820 | 710 | 245 | 4,340 | $3.6 billion |
| 48 | 47 | Mondelez International |
808 | 64 | - | 1,031 | $8.2 billion |
| 49 | 21 | Univar Solutions |
769 | 65 | - | 2,047 | $6.6 billion |
| 50 | 61 | Anheuser-Busch Cos. |
759 | 148 | - | 800 | $15.6 billion |
| 51 | 60 | Shaw Industries Group |
750 | 55 | - | 3,000 | - |
| 52 | 56 | Calfrac Well Services |
740 | 203 | - | 1,067 | $0.5 billion |
| 53 | 57 | JBS USA Holdings |
739 | - | - | 1,336 | - |
| 54 | 59 | Southern Glazer's Wine & Spirits |
721 | 2,189 | - | 820 | - |
| 55 | WillScot Mobile Mini Holdings Corp. |
707 | 274 | - | 1,272 | $1.4 billion |
|
| 56 | 55 | Shamrock Foods Co. |
696 | 107 | - | 1,028 | - |
| 57 | 54 | Brenntag North America |
691 | 474 | - | 2,158 | $4.8 billion |
| 58 | 64 | Publix Super Markets |
689 | 13 | - | 3,840 | $44.9 billion |
| 59 | 53 | Plains All American Pipeline |
680 | - | - | 840 | $23.3 billion |
| 60 | 65 | Veritiv Corp. |
661 | 53 | - | 1,026 | $6.3 billion |
| 61 | 51 | Messer Americas |
657 | 228 | 261 | 2,066 | - |
| 62 | 72 | MDU Resources Group |
651 | 2,009 | - | 2,095 | $5.5 billion |
| 63 | 63 | Coca-Cola Beverages Northeast |
644 | 77 | - | 909 | - |
| 64 | 79 | SE Independent Delivery Services |
637 | 250 | - | 2,155 | - |
| 65 | 69 | Advanced Drainage Systems |
620 | 1 | - | 1,195 | $1.7 billion |
| 66 | 87 | Costco Wholesale Corp. |
611 | 320 | - | 4,725 | $163.2 billion |
| 67 | 67 | Stericycle Inc. |
603 | 4,186 | - | 2,555 | $2.7 billion |
| 68 | 68 | Mohawk Industries |
595 | 156 | - | 2,544 | $9.6 billion |
| 69 | 71 | Beacon Roofing Supply |
579 | 1,837 | - | 1,232 | $6.9 billion |
| 70 | 73 | Air Products |
578 | 98 | 339 | 2,000 | $8.9 billion |
| 70 | KLX Energy Services Holdings Inc. |
578 | 993 | - | 1,061 | $0.3 billion |
|
| 72 | 73 | Coca-Cola Beverages Florida |
574 | 28 | - | 758 | - |
| 73 | 76 | Herc Rentals |
572 | 369 | - | 685 | $1.8 billion |
| 74 | 77 | H-E-B Grocery Co. |
567 | 8 | - | 3,002 | - |
| 75 | 85 | Foster Farms |
566 | 9 | - | 1,202 | - |
| 76 | 80 | Sanderson Farms |
556 | 26 | - | 664 | $3.6 billion |
| 77 | 70 | Liberty Coca-Cola Beverages |
553 | 136 | - | 722 | - |
| 78 | 78 | Ecology Auto Parts |
543 | 12 | - | 659 | - |
| 79 | 86 | SpartanNash |
538 | 4 | - | 1,225 | $9.3 billion |
| 80 | 34 | Builders FirstSource |
520 | 1,267 | - | 1,312 | $8.6 billion |
| 81 | 81 | Archer Daniels Midland Co. |
519 | - | - | 1,453 | $64.4 billion |
| 82 | 95 | The H.T. Hackney Co. |
505 | 191 | - | 740 | - |
| 83 | 83 | Ace Hardware Corp. |
500 | - | - | 1,400 | $7.8 billion |
| 84 | 93 | Columbia Distributing |
478 | 95 | - | 585 | - |
| 85 | 88 | KeHE Distributors |
472 | 1 | - | 793 | $5.0 billion |
| 86 | 96 | Bunzl Distribution USA |
457 | 32 | - | 864 | - |
| 87 | 98 | Hobby Lobby Stores Inc. |
456 | 8 | - | 1,543 | - |
| 88 | 94 | C&S Wholesale Grocers |
451 | - | - | 4,543 | - |
| 89 | 26 | Linde |
450 | 1,423 | - | 1,893 | $10.5 billion |
| 90 | 92 | Key Energy Services |
430 | 533 | - | 503 | - |
| 91 | 82 | Domino's Pizza |
419 | 48 | - | 587 | $4.1 billion |
| 92 | 62 | Nine Energy Service |
415 | 310 | - | 605 | $0.3 billion |
| 93 | Wilbur-Ellis |
403 | 856 | - | 1,167 | $3.0 billion |
|
| 94 | 90 | Valley Proteins |
402 | 128 | - | 1,342 | - |
| 95 | Thyssenkrupp North America |
399 | 537 | - | 793 | - | |
| 96 | 100 | Dunkin' |
397 | 12 | - | 450 | - |
| 97 | 91 | Bragg Cos. |
396 | - | - | 575 | - |
| 98 | Orgill Inc. |
393 | 2 | - | 1,080 | $3.0 billion |
|
| 99 | Matheson Tri-Gas |
392 | 685 | - | 918 | - | |
| 100 | Lowe's Companies Inc. |
388 | 3,464 | - | 462 | $89.6 billion |
The Top 100 Private Carriers Companies on this list operate their own trucks to carry freight and are ranked on the basis of the total number of highway tractors in the fleet. To be included in the Top 100 list, please send contact information to tteditor@ttnews.com. We will contact you via phone or e-mail to get information about your company prior to publication of the next Top 100 list.
Amazon Profits, Revenue Surge in Q2
NEW YORK — Amazon on Aug. 3 posted better-than-expected revenue and profits for the second quarter, sending its stock higher in after-hours trading.
Amazon Fresh Offers Grocery Delivery to Non-Prime Members
Amazon has begun offering its Fresh grocery delivery service to customers who aren’t Prime members.
Amazon to Double Number of Same-Day Delivery Facilities
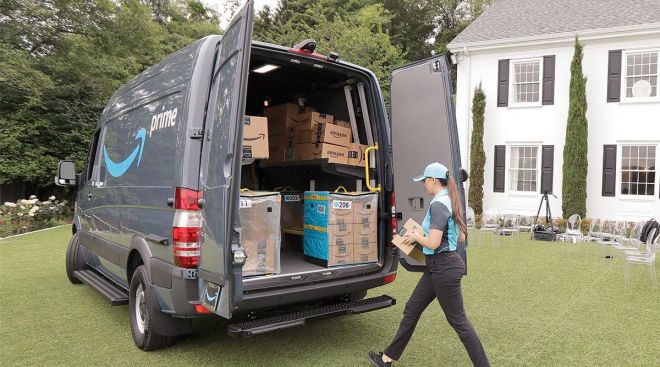
Amazon.com Inc. will double the number of U.S. same-day delivery facilities in the “coming years,” the company announced July 31.
United Rentals Profit Rises on Ahern Deal, Demand Tailwind
United Rentals Inc. reported net income of $591 million in the second quarter of 2023, an increase of 19.9% from $493 million in the year-ago period, the company said.
Walmart Seen Gaining More Than 30% Over the Next Year
Walmart Inc. shares could surge more than 30% in the next 12 months as the shopping behemoth continues to gain market share even as grocery inflation eases, according to Piper Sandler.
Amazon to Roll Out Palm Payment Technology at Whole Foods
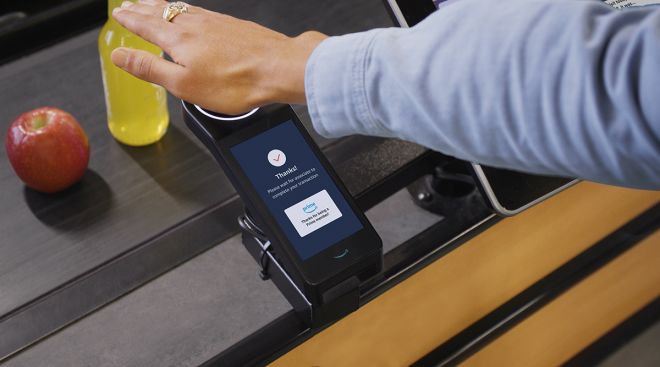
Customers at Amazon’s Whole Foods Market stores will soon be able to pay for their groceries with a wave of their hand.
Amazon Says Its Carbon Emissions Fell for First Time
Amazon’s carbon emissions ticked lower for the first time since the company began reporting the figure, citing increased purchases of renewable electricity and a slowdown in sales growth.
PepsiCo Lifts 2023 Profit Forecast as Q2 Revenue Up 10%
Higher prices lifted PepsiCo’s revenue in the second quarter but dented consumer demand, and the company said July 13 price increases could start to moderate in the second half of this year.
Amazon Prime Day Drives All Online Sales Up 6.1%

U.S. shoppers spent $12.7 billion online during Amazon.com Inc.’s 48-hour Prime Day, up 6.1% from a year ago but short of estimates for 9.5% growth, according to Adobe Inc.
Amazon Prime Day Pushes Online Sales Up 6% in First 24 Hours
U.S. consumers spent $6.4 billion online in the first 24 hours of Amazon's Prime Day, according to Adobe Inc., up 6% from a year ago but short of estimates for even stronger growth.
-

2022
-
2021
-
2020
-
2019
-
2018
-
2017
-
2016
-
2015
-
2014
-
2013
-
2012
-
2011
-
2010
-
2009
-
2008
-
2007
-
2006
-
2005
-
2004


