


| Rank This Year | Rank Last Year | Company | Tractors | Trucks | Pickups/ Cargo Vans | Trailers | Annual Revenue |
|---|---|---|---|---|---|---|---|
| 1 | 1 | PepsiCo Inc. |
8,397 | 14,906 | - | 11,734 | $66.7 billion |
| 2 | 2 | Sysco Corp. |
7,647 | 1,190 | 388 | 9,577 | $46.5 billion |
| 3 | 4 | Wal-Mart Stores |
6,294 | 106 | - | 61,528 | $482.2 billion |
| 4 | 3 | Coca-Cola |
5,664 | 1,054 | - | 7,465 | $46.0 billion |
| 5 | 6 | Halliburton |
5,637 | 1,160 | - | 5,637 | $29.4 billion |
| 6 | 5 | U.S. Foods |
5,190 | 333 | - | 6,461 | $22.0 billion |
| 7 | 8 | Agrium Inc. |
3,806 | 2,479 | 7,627 | 5,937 | $13.0 billion |
| 8 | 9 | Reyes Holdings |
3,647 | 587 | 442 | 4,618 | $24.0 billion |
| 9 | 7 | McLane Co. |
3,537 | 305 | 9 | 5,283 | $46.0 billion |
| 10 | 11 | Schlumberger Limited |
3,394 | 1,299 | - | 4,770 | $48.6 billion |
| 11 | 10 | C & J Energy Services |
2,970 | 1,661 | - | 4,517 | $1.6 billion |
| 12 | 12 | Tyson Foods |
2,785 | - | 1,119 | 3,700 | $37.6 billion |
| 13 | 14 | Performance Food Group |
2,534 | 96 | - | 3,122 | - |
| 14 | 25 | CHS Inc. |
2,496 | 1,001 | - | 2,193 | $42.7 billion |
| 15 | 13 | Dr Pepper Snapple Group |
2,342 | 81 | 1,330 | 2,828 | $6.1 billion |
| 16 | 15 | Baker Hughes Inc. |
2,282 | 1,813 | - | 2,856 | $24.6 billion |
| 17 | 23 | Clean Harbors Inc. |
1,906 | 6,739 | - | 4,188 | $3.4 billion |
| 18 | 16 | Dean Foods Co. |
1,900 | 3,000 | 445 | 5,500 | $9.5 billion |
| 19 | 24 | Gordon Food Service |
1,700 | 88 | - | 2,158 | - |
| 20 | 20 | Weatherford International |
1,684 | 1,046 | - | 3,379 | $14.9 billion |
| 21 | 18 | Basic Energy Services |
1,620 | 386 | - | 1,819 | $1.5 billion |
| 22 | 22 | The Kroger Co. |
1,474 | 35 | - | 5,386 | $108.5 billion |
| 23 | 17 | United Rentals Inc. |
1,420 | 2,204 | - | 1,484 | $5.7 billion |
| 24 | 21 | Airgas Inc. |
1,410 | 2,781 | 1,236 | 3,857 | $5.1 billion |
| 25 | 19 | Gibson Energy Inc. |
1,400 | - | - | 2,600 | $8.6 billion |
| 26 | 33 | Albertsons |
1,378 | 621 | 88 | 5,225 | - |
| 27 | 44 | Key Energy Services |
1,355 | 1,897 | - | 1,500 | $1.4 billion |
| 28 | 38 | Helena Chemical Co. |
1,204 | 1,735 | - | 2,575 | - |
| 29 | 29 | Dot Foods |
1,190 | 2 | 16 | 1,835 | - |
| 30 | 27 | Praxair Inc. |
1,099 | 1,877 | - | 3,677 | $12.3 billion |
| 31 | 28 | Prairie Farms Dairy |
1,094 | 1,348 | 250 | 2,946 | - |
| 32 | 39 | Pilot Flying J Inc. |
1,035 | - | - | 1,331 | - |
| 33 | 30 | Cemex USA |
1,028 | 5,141 | - | 1,677 | $3.7 billion |
| 34 | 33 | Plains All American Pipeline |
990 | - | - | 1,900 | $43.5 billion |
| 35 | - | Builders FirstSource |
968 | 2,506 | - | 1,693 | $1.6 billion |
| 36 | 32 | Nestle USA |
936 | 4,216 | - | 1,313 | $9.7 billion |
| 37 | 31 | Veritiv Corp. |
870 | 199 | 172 | 1,290 | $7.4 billion |
| 38 | 49 | Sunbelt Rentals |
840 | 2,285 | - | 831 | $2.7 billion |
| 39 | 36 | Ben E. Keith Co. |
825 | 52 | - | 1,053 | - |
| 40 | 35 | Air Products Inc. |
811 | 115 | 400 | 2,100 | $10.4 billion |
| 41 | 41 | Darling Ingredients Inc. |
810 | 705 | 336 | 4,050 | $4.0 billion |
| 42 | 43 | Shaw Industries Group |
755 | 51 | 172 | 3,332 | $4.8 billion |
| 43 | 37 | Walgreen Co. |
754 | 10 | - | 1,848 | $76.4 billion |
| 44 | 26 | Calfrac Well Services |
744 | 378 | 9 | 914 | $2.3 billion |
| 45 | 52 | Linde North America |
733 | 1,840 | - | 2,060 | $2.0 billion |
| 46 | 40 | Kellogg Co. |
710 | 60 | - | 1,153 | $14.6 billion |
| 47 | 46 | Univar Inc. |
699 | 74 | - | 1,346 | - |
| 48 | 50 | Delhaize America |
684 | - | - | 3,253 | - |
| 48 | 73 | Perdue Farms Inc. |
684 | 79 | 600 | 2,100 | - |
| 50 | 45 | Lowe's Cos. Inc. |
662 | 3,844 | - | 681 | $56.2 billion |
| 51 | 42 | Nuverra Environmental Solutions |
653 | 417 | - | 1,012 | $0.5 billion |
| 52 | 53 | United Natural Foods Inc. |
652 | - | - | 835 | $6.8 billion |
| 53 | 54 | Ashley Furniture Industries |
646 | 7 | - | 2,300 | - |
| 54 | 58 | Cole-Mark Holding Co. |
639 | 64 | - | 794 | $10.3 billion |
| 55 | 61 | Advanced Drainage Systems |
625 | - | - | 1,100 | $1.2 billion |
| 56 | 50 | Mondelez International Inc. |
610 | 300 | 49 | 730 | $34.2 billion |
| 57 | 56 | Publix Super Markets |
605 | 30 | 401 | 2,909 | $30.6 billion |
| 58 | 70 | Love's Travel Stops $amp;amp; Country Stores |
600 | - | 20 | 620 | - |
| 59 | 48 | JBS USA Holdings |
599 | - | - | 1,290 | - |
| 60 | 64 | Food Services of America |
597 | 52 | - | 741 | - |
| 61 | 60 | ABC Supply Co. |
585 | 2,033 | 190 | 818 | - |
| 62 | 55 | Golden State Foods |
573 | 42 | - | 858 | $6.5 billion |
| 63 | 59 | Archer Daniels Midland Co. |
561 | 84 | - | 1,510 | $81.2 billion |
| 64 | - | Maxim Crane Works |
556 | - | - | 910 | - |
| 65 | - | Quikrete Cos. |
554 | 23 | - | 929 | - |
| 66 | - | Sanjel Corp. |
547 | - | - | - | - |
| 67 | - | Pilot Thomas Logistics |
542 | 826 | - | 870 | - |
| 68 | - | C&S Wholesale Grocers |
541 | - | - | 1,434 | $25.9 billion |
| 69 | 61 | MDU Resources Group |
539 | 1,873 | - | 1,915 | $4.5 billion |
| 70 | 63 | American Air Liquide Holdings |
529 | 57 | - | 1,244 | - |
| 71 | 65 | Bunzl Distribution USA |
520 | 24 | 8 | 835 | - |
| 72 | - | Cudd Energy Services |
514 | 260 | - | 956 | $2.3 billion |
| 73 | - | Energy Transfer Partners |
508 | 108 | - | 543 | $51.2 billion |
| 74 | 66 | H.E.B. Grocery Co. |
505 | 9 | - | 2,840 | - |
| 74 | 71 | Oldcastle Inc. |
505 | 1,732 | - | 1,509 | - |
| 76 | 79 | Shamrock Foods Co. |
504 | 60 | 75 | 757 | - |
| 77 | - | Veolia North America |
489 | 1,546 | - | 1,231 | - |
| 78 | 75 | Pepsi Bottling Ventures |
466 | 147 | 202 | 530 | - |
| 79 | 82 | Ace Hardware Corp. |
450 | - | - | 1,126 | $4.7 billion |
| 80 | 67 | Foster Farms |
449 | 136 | - | 1,089 | - |
| 80 | - | SE Independent Delivery Services |
449 | 150 | - | 1,126 | - |
| 82 | 84 | Sentinel Transportation |
439 | 55 | 41 | 1,168 | - |
| 83 | 81 | Bimbo Bakeries USA |
437 | 4,135 | - | 1,365 | - |
| 83 | 71 | Supervalu Inc. |
437 | 4 | - | 1,807 | $17.8 billion |
| 83 | 85 | The H.T. Hackney Co. |
437 | 172 | - | 593 | - |
| 86 | 77 | Sherwin-Williams Co. |
436 | 1 | - | 1,447 | $11.1 billion |
| 87 | - | Coca-Cola Bottling Co. United |
426 | 231 | - | 465 | - |
| 88 | 74 | Mohawk Industries |
420 | 138 | - | 2,217 | $7.8 billion |
| 89 | 77 | Sanderson Farms Inc. |
408 | 31 | - | 575 | $2.8 billion |
| 90 | 68 | Patterson-UTI Energy Co. |
407 | 432 | - | 605 | $3.2 billion |
| 91 | 69 | BlueLinx Holdings |
401 | 6 | - | 615 | $2.0 billion |
| 92 | - | Hertz Equipment Rental |
397 | 745 | - | 431 | $1.6 billion |
| 93 | 94 | Valley Proteins Inc. |
380 | 107 | 30 | 1,033 | - |
| 94 | - | KeHE Distributors |
375 | - | - | 575 | - |
| 95 | 87 | Castellini Co. |
373 | - | - | 530 | - |
| 96 | - | Ecolab Inc. |
371 | 576 | - | 369 | $14.0 billion |
| 96 | 83 | Maines Paper & Food Service |
371 | 62 | - | 501 | $4.0 billion |
| 98 | 90 | AmeriGas Partners |
370 | 8,775 | - | 1,040 | $3.7 billion |
| 98 | 86 | J.R. Simplot Co. |
370 | 793 | - | 1,444 | - |
| 100 | 90 | Nexeo Solutions |
369 | 3 | - | 643 | $4.5 billion |
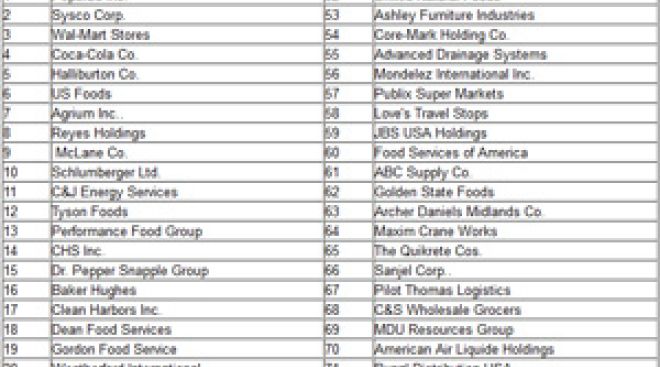
The Top 100 Private Carriers on this list operate their own trucks to carry freight and are ranked on the basis of the total number of highway tractors in the fleet. To be included in the Top 100 list, please send contact information to tteditor@ttnews.com. We will contact you via phone or e-mail to get information about your company prior to publication of the next Top 100 list.
On the Bubble
Costco Profit Beats Estimates on Healthy Consumer Spending

Costco Wholesale Corp. posted quarterly profit that beat expectations, showing the big-box retailer remains unfazed by tighter consumer spending.
Agriculture Industry Talks With Trump Team on Immigration

The U.S. agriculture industry has started talks with Donald Trump’s transition team in a bid to advocate for the food business as the president-elect pledges tariffs and mass deportations.
December 13, 2024Hershey’s Main Owner Rejects Mondelez’s Offer as Too Low

The main owner of chocolate maker Hershey has rejected a preliminary takeover offer from Mondelez International Inc., people familiar with the matter said.
December 11, 2024Hershey Could Be More Open to Mondelez Takeover

Mondelez International’s latest overture to Hershey underscores the challenges posed by high cocoa prices and penny-pinching consumers, which could make the company more open to a deal.
December 11, 2024Albertsons Sues Kroger for Failing to Secure Merger

Albertsons is giving up on its merger with Kroger and it is suing the grocery chain, saying it didn’t do enough to secure regulatory approval for the $24.6 billion agreement.
Mondelez Approves $9 Billion Buyback After Hershey Report

Mondelez International approved a stock repurchase authorization of as much as $9 billion, days after a report that the company was exploring an acquisition of chocolate maker Hershey.
Kroger’s $24.6 Billion Albertsons Deal Blocked by Judge

A judge blocked Kroger's $24.6 billion acquisition of Albertsons Cos., finding the takeover would lessen competition for grocery shoppers in a ruling that marks a likely death knell for the deal.
Mondelez’s Takeover of Hershey Would Rank as Top 2024 Deal

Snack-food giant Mondelez International’s potential takeover of chocolate maker Hershey Co. would rank as the year’s top M&A deal.
Tally of US Shoppers Slipped During Thanksgiving Weekend

Fewer Americans shopped during Thanksgiving weekend this year, a sign that consumers remain selective about spending.
Tyson to Shut Kansas Plant as US Beef Shortage Erodes Profit

Tyson Foods will shut a meat plant in Kansas next year, eliminating 809 jobs, as the company seeks to slash costs amid a downturn in the beef industry.
-

2023
-
2022
-
2021
-
2020
-
2019
-
2018
-
2017
-
2016
-
2015
-
2014
-
2013
-
2012
-
2011
-
2010
-
2009
-
2008
-
2007
-
2006
-
2005
-
2004


