


| Rank This Year | Rank Last Year | Company | Revenue (000) | Net Income (000) | Employees | Tractors* | Trailers |
|---|---|---|---|---|---|---|---|
| 88 | Leonard's Express
|
327,000 | - | 700 | 582 | 1,000 | |
| 89 | Western Flyer Express
|
320,000 | - | 1,150 | 4,000 | ||
| 91 | Beemac Trucking
|
301,000 | - | 130 | 525 | 610 | |
| 92 | New Legend Inc.
|
294,000 | 37,000 | 1,400 | 1,000 | 4,600 | |
| 94 | Oak Harbor Freight Lines
|
284,000 est |
- | 1,700 | 777 | 2,487 | |
| 95 | Transervice Logistics
|
278,300 | - | 1,200 | 366 | 2,181 | |
| 96 | Artur Express
|
272,000 | - | 471 | 776 | 3,047 | |
| 97 | Paschall Truck Lines
|
265,000 | - | 1,545 | 1,170 | 3,500 | |
| 83 | Dependable Supply Chain Services
|
363,000 | - | 1,965 | 462 | 1,167 | |
| 100 | Paper Transport
|
244,000 | - | 1,100 | 850 | 3,200 | |
| 1 | 1 | UPS Inc.
|
97,300,000 | 12,900,000 | 534,000 | 15,554 | 85,398 |
| 2 | 2 | FedEx Corp.
|
91,683,000 | 6,118,000 | 577,000 | 37,488 | 136,947 |
| 3 | 3 | XPO
|
12,800,000 | 323,000 | 42,000 | 7,900 | 25,800 |
| 4 | 4 | J.B. Hunt Transport Services
|
12,168,000 | 760,800 | 34,978 | 18,617 | 39,994 |
| 5 | 5 | TFI International
|
7,220,000 | 664,000 | 29,539 | 22,812 | 50,091 |
| 7 | 6 | Knight-Swift Transportation Holdings
|
6,000,000 | 966,000 | 27,900 | 21,351 | 75,019 |
| 8 | 7 | Schneider
|
5,600,000 | 405,000 | 16,050 | 11,300 | 36,700 |
| 10 | 8 | Yellow Corp.
|
5,122,000 | 104,000 | 32,000 | 14,200 | 42,000 |
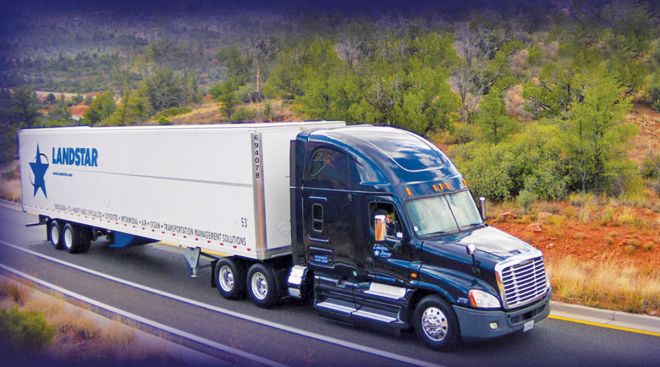
| 6 | 9 | Landstar System
|
6,538,000 | 721,000 | 1,399 | 11,864 | 18,307 |
| 9 | 10 | Old Dominion Freight Line
|
5,256,000 | 1,034,000 | 24,372 | 10,403 | 41,220 |
| 11 | 11 | Ryder Supply Chain Solutions
|
4,612,000 | 166,000 | 41,900 | 70,700 | 43,500 |
| 12 | 12 | Estes Express Lines
|
4,447,000 | - | 21,700 | 8,500 | 34,000 |
| 13 | 13 | Hub Group
|
4,232,000 | 171,000 | 5,000 | 3,600 | 6,100 |
| 15 | 14 | Penske Logistics
|
3,700,000 | - | 19,994 | 5,583 | 13,771 |
| 14 | 15 | ArcBest
|
3,980,000 | 214,000 | 14,000 | 4,360 | 23,438 |
| 16 | 16 | NFI
|
3,100,000 | - | 15,500 | 4,600 | 13,000 |
| 17 | 17 | Werner Enterprises
|
2,734,000 | 259,000 | 13,525 | 8,775 | 27,225 |
| 20 | 18 | Prime Inc.
|
2,408,000 | 351,000 | 4,411 | 7,601 | 14,700 |
| 19 | 19 | R+L Carriers
|
2,427,000 est |
- | 6,774 | 19,709 | |
| 21 | 20 | Saia Inc.
|
2,300,000 | 335,000 | 12,000 | 5,600 | 19,300 |
| 23 | 21 | U.S. Xpress Enterprises
|
1,949,000 | 11,000 | 8,689 | 6,400 | 13,600 |
| 18 | 22 | Purolator
|
2,600,000 | 293,000 | 13,533 | 522 | 2,005 |
| 24 | 23 | Kenan Advantage Group
|
1,904,000 est |
- | 9,311 | 7,121 | 12,235 |
| 25 | 24 | CRST The Transportation Solution
|
1,800,000 | - | 6,536 | 4,894 | 14,289 |
| 29 | 25 | C.R. England
|
1,644,000 | - | 6,588 | 3,833 | 5,897 |
| 31 | 26 | Daseke Inc.
|
1,557,000 | 56,000 | 4,006 | 4,697 | 11,266 |
| 22 | 27 | Evans Delivery
|
2,050,000 | - | 650 | 9,000 | 3,000 |
| 26 | 29 | Universal Logistics Holdings
|
1,751,000 | - | 8,000 | 4,066 | 3,800 |
| 33 | 30 | UniGroup
|
1,499,000 | - | 835 | 2,889 | 4,767 |
| 34 | 31 | Day & Ross
|
1,489,000 | - | 8,400 | 4,600 | 9,150 |
| 30 | 32 | Anderson Trucking Service
|
1,567,000 | - | 2,325 | 2,588 | 7,082 |
| 27 | 33 | Forward Air
|
1,662,000 | 116,000 | 4,327 | 865 | 6,370 |
| 35 | 34 | Southeastern Freight Lines
|
1,476,000 | - | 8,490 | 2,788 | 8,060 |
| 38 | 35 | Ruan
|
1,227,820 | - | 5,500 | 3,475 | 8,210 |
| 32 | 36 | Averitt Express
|
1,532,000 | - | 9,000 | 5,090 | 15,071 |
| 37 | 37 | Crete Carrier Corp.
|
1,304,000 | - | 6,500 | 5,000 | 13,000 |
| 51 | 38 | Quality Carriers
|
850,000 | - | 1,600 | 2,600 | 7,500 |
| 39 | 39 | Lynden
|
1,080,000 | - | 2,472 | 880 | 2,430 |
| 36 | 40 | PS Logistics
|
1,375,000 | - | 3,100 | 3,625 | 5,700 |
| 48 | 41 | KLLM Transport Services
|
953,000 | - | 3,200 | 6,100 | |
| 46 | 42 | Marten Transport
|
974,000 | 85,000 | 4,007 | 3,204 | 5,299 |
| 40 | 43 | Central Transport International
|
1,046,000 est |
- | 2,953 | 11,877 | |
| 49 | 44 | 10 Roads Express
|
917,000 | - | 5,052 | 5,287 | |
| 44 | 45 | Cardinal Logistics
|
981,000 | - | 4,200 | 3,025 | 8,000 |
| 40 | 46 | Covenant Logistics Group
|
1,046,000 | - | 5,600 | 2,563 | 5,213 |
| 27 | 47 | OnTrac Inc.
|
1,662,000 est |
- | |||
| 50 | 48 | Pitt Ohio Transportation Group
|
900,000 | - | 5,087 | 1,565 | 3,995 |
| 46 | 49 | Atlas World Group
|
974,000 | 17,000 | 655 | 1,653 | 3,615 |
| 45 | 51 | Western Express
|
977,000 | - | 4,400 | 3,150 | 8,400 |
| 56 | 52 | United Road Services
|
713,000 est |
- | 1,837 | 1,978 | 2,110 |
| 54 | 53 | AAA Cooper Transportation
|
776,000 | - | 5,000 | 2,650 | |
| 42 | 54 | Bennett International Group
|
998,000 | - | 1,114 | 2,726 | 1,865 |
| 60 | 55 | Dayton Freight Lines
|
684,000 | 145,000 | 5,593 | 1,813 | 4,970 |
| 66 | 56 | Heartland Express
|
607,000 | 79,000 | 3,180 | 3,193 | 10,741 |
| 53 | 57 | Bison Transport
|
778,000 | - | 3,732 | 2,115 | 6,057 |
| 55 | 58 | Stevens Transport
|
745,000 | 129,000 | 2,900 | 2,050 | 3,600 |
| 59 | 59 | Canada Cartage System
|
701,000 | - | 4,332 | 2,880 | 2,700 |
| 52 | 60 | Mullen Group
|
838,000 | - | 4,622 | 2,241 | 6,151 |
| 67 | 61 | Trimac Transportation
|
600,000 est |
- | 1,681 | 3,250 | |
| 62 | 63 | Cowan Systems
|
655,000 | - | 2,301 | 2,346 | 7,487 |
| 68 | 64 | Heniff Transportation Systems
|
562,000 est |
- | 1,806 | 5,066 | |
| 57 | 65 | USA Truck (DB Schenker)
|
710,000 | 25,000 | 2,069 | 2,157 | 6,548 |
| 64 | 66 | Hirschbach Motor Lines
|
626,000 | - | 1,990 | 2,299 | 3,861 |
| 69 | 67 | Two Men and a Truck Movers
|
525,000 est |
- | 11,396 | ||
| 71 | 68 | Jack Cooper Holdings
|
507,000 est |
- | 3,753 | 1,286 | 1,284 |
| 63 | 69 | A. Duie Pyle Inc.
|
628,000 | - | 3,734 | 1,444 | 2,962 |
| 65 | 70 | Mercer Transportation Co.
|
614,000 | - | 247 | 2,180 | 2,180 |
| 58 | 71 | P.A.M. Transport
|
707,100 | 76,500 | 2,510 | 1,970 | 6,859 |
| 43 | 72 | IMC Cos.
|
983,000 | - | 2,371 | 1,700 | 150 |
| 70 | 73 | Roehl Transport
|
521,000 | - | 2,968 | 2,074 | 5,883 |
| 75 | 74 | TMC Transportation
|
450,000 est |
- | 3,098 | 4,252 | |
| 77 | 75 | Roadrunner Freight
|
430,000 est |
- | |||
| 76 | 76 | Foodliner/Quest Liner
|
437,000 | - | 1,562 | 1,608 | 2,914 |
| 72 | 77 | Fastfrate Group
|
500,000 | - | 3,000 | 1,152 | 1,644 |
| 73 | 78 | Mesilla Valley Transportation
|
494,000 | - | 2,616 | 1,796 | 6,000 |
| 79 | 79 | Maverick USA
|
398,000 | - | 1,977 | 1,458 | 2,671 |
| 81 | 80 | Dart Transit Co.
|
377,600 est |
- | 2,051 | 7,140 | |
| 93 | 81 | ContainerPort Group
|
287,000 | - | 363 | 1,296 | 16 |
| 78 | 82 | Challenger Motor Freight
|
402,000 | - | 1,200 | 1,545 | 3,380 |
| 61 | 83 | R&R Express
|
680,000 | - | 397 | 504 | 642 |
| 87 | 84 | John Christner Trucking
|
334,000 | 17,000 | 315 | 754 | 1,236 |
| 82 | 85 | Red Classic
|
365,000 | - | 1,206 | 649 | 3,500 |
| 85 | 86 | Koch Cos.
|
359,000 | - | 1,213 | 983 | 5,689 |
| 74 | 87 | Quantix Supply Chain Solutions
|
454,000 | -72,000 | 1,850 | 1,632 | 3,594 |
| 84 | 90 | Dupré Logistics
|
360,000 | 188,000 | 1,260 | 750 | 2,000 |
| 86 | 92 | Melton Truck Lines
|
338,000 | - | 1,611 | 1,233 | 2,191 |
| 80 | 94 | Daylight Transport
|
380,000 | - | |||
| 90 | 95 | Trans-System Inc.
|
315,000 | - | 990 | 940 | 1,886 |
| 98 | 99 | PGT Trucking
|
253,700 | - | 695 | 1,138 | 1,825 |
| 99 | 100 | Smith Transport
|
246,000 est |
- | 1,136 | 816 | 2,250 |
Top For-Hire Carriers on this list are common and contract freight carriers operating in the United States, Canada and Mexico. Companies are ranked on the basis of annual revenue. To be included in the Top 100 or any of the sectors, please send contact information to tteditor@ttnews.com. We will contact you via phone or e-mail to get information about your company prior to publication of the next Top 100 list.
Revenues for the following carriers are estimated by SJ Consulting Group: R+L Carriers, LaserShip/OnTrac, Crete Carrier Corp., Central Transport International, Oak Harbor Freight Lines.
FedEx Corp. revenue is for 12-month period ended Feb. 28, 2022.
Ruan revenue is for 2020.
10 Roads Express revenue is estimated by Culhane Meadows Pllc.
United Road Services revenue is for 2019.
Trimac revenue is for 2020.
Heniff Transportation Systems revenue is estimated for 2020.
Two Men and a Truck revenue is for 2019.
Jack Cooper Holdings revenue is estimated by SJ Consulting Group for 2019.
TMC Transportation revenue is for 2019.
Roadrunner Freight revenue is for 2019.
Dart Transit Co. revenue is estimated by SJ Consulting Group for 2020.
PGT Trucking revenue is for 2020.
Smith Transport revenue is for 2020.
* Tractor count includes company-owned, lease-to-own and owner-operator tractors.


Port Charleston Freight Tied to Averitt Express Expansion
South Carolina state officials have welcomed a $4.58 million expansion by Averitt Express of its operations in Charleston County to meet freight needs from the Port of Charleston.
UPS-Teamsters Negotiations Remain Stalled

UPS on July 11 pushed to Aug. 8 the release date for its second-quarter financial report, a week after its labor contract with the International Brotherhood of Teamsters is set to expire.
UPS Schedules Later Release of Midyear Earnings

UPS Inc. investors will wait longer than usual to hear from CEO Carol Tomé this quarter as the company works to avoid a harmful worker strike.
Yellow Gains Financial Targets Waiver
Yellow Corp. will not have to meet certain financial targets under a deal with its lenders, winning valuable breathing space as it battles the Teamsters union and the threat of bankruptcy.
Analysts: Walkout at UPS Would Have Deep Impact on Economy

A strike by UPS workers if a new labor agreement isn’t reached with the Teamsters would hold significant implications across the supply chain, industry analysts said.
Knight-Swift Closes Acquisition of U.S. Xpress
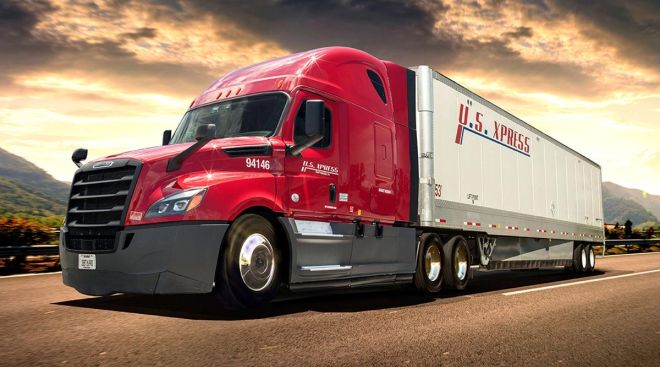
Knight-Swift Transportation Holdings closed on its previously announced acquisition of U.S. Xpress Enterprises, the company announced July 5.
UPS-Teamsters Talks Break Down
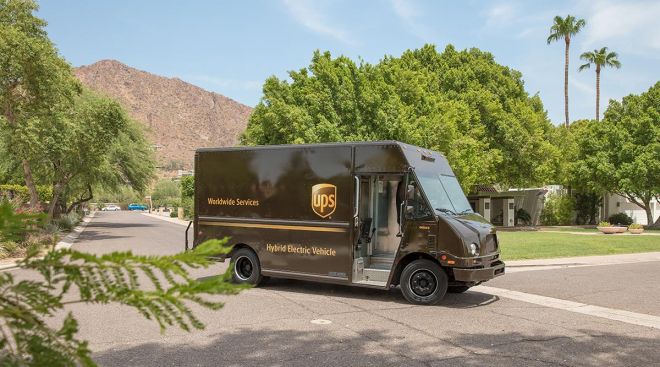
Negotiations on a new labor deal between UPS Inc. and the Teamsters stalled July 5 after showing promise over the weekend, renewing concern that workers could strike at the end of the month.
Industry Sector Rankings Show Growth, Acquisitions by Carriers
Most of North America’s largest for-hire carriers operating in many diverse segments of the trucking industry reported higher revenues last year.
Fleets Turn to Tech to Manage Complexity of Regulatory Compliance
With more drivers and equipment to manage, some fleet operators have implemented technology to help navigate the complexity of the industry’s regulations and better manage safety audits.
Industry Stakeholders Take Aim at Truck Parking Shortage
According to reports from the American Transportation Research Institute, truck parking has been one of the industry’s top concerns for several years.
-

2022
-
2021
-
2020
-
2019
-
2018
-
2017
-
2016
-
2015
-
2014
-
2013
-
2012
-
2011
-
2010
-
2009
-
2008
-
2007
-
2006
-
2005
-
2004


