


| Rank This Year | Rank Last Year | Company | Revenue (000) | Net Income (000) | Employees | Tractors* | Trailers |
|---|---|---|---|---|---|---|---|
| 94 | Oak Harbor Freight Lines
|
284,000 est |
- | 1,700 | 777 | 2,487 | |
| 95 | Transervice Logistics
|
278,300 | - | 1,200 | 366 | 2,181 | |
| 96 | Artur Express
|
272,000 | - | 471 | 776 | 3,047 | |
| 97 | Paschall Truck Lines
|
265,000 | - | 1,545 | 1,170 | 3,500 | |
| 83 | Dependable Supply Chain Services
|
363,000 | - | 1,965 | 462 | 1,167 | |
| 100 | Paper Transport
|
244,000 | - | 1,100 | 850 | 3,200 | |
| 88 | Leonard's Express
|
327,000 | - | 700 | 582 | 1,000 | |
| 89 | Western Flyer Express
|
320,000 | - | 1,150 | 4,000 | ||
| 91 | Beemac Trucking
|
301,000 | - | 130 | 525 | 610 | |
| 92 | New Legend Inc.
|
294,000 | 37,000 | 1,400 | 1,000 | 4,600 | |
| 1 | 1 | UPS Inc.
|
97,300,000 | 12,900,000 | 534,000 | 15,554 | 85,398 |
| 2 | 2 | FedEx Corp.
|
91,683,000 | 6,118,000 | 577,000 | 37,488 | 136,947 |
| 3 | 3 | XPO
|
12,800,000 | 323,000 | 42,000 | 7,900 | 25,800 |
| 4 | 4 | J.B. Hunt Transport Services
|
12,168,000 | 760,800 | 34,978 | 18,617 | 39,994 |
| 5 | 5 | TFI International
|
7,220,000 | 664,000 | 29,539 | 22,812 | 50,091 |
| 7 | 6 | Knight-Swift Transportation Holdings
|
6,000,000 | 966,000 | 27,900 | 21,351 | 75,019 |
| 8 | 7 | Schneider
|
5,600,000 | 405,000 | 16,050 | 11,300 | 36,700 |
| 10 | 8 | Yellow Corp.
|
5,122,000 | 104,000 | 32,000 | 14,200 | 42,000 |
| 6 | 9 | Landstar System
|
6,538,000 | 721,000 | 1,399 | 11,864 | 18,307 |
| 9 | 10 | Old Dominion Freight Line
|
5,256,000 | 1,034,000 | 24,372 | 10,403 | 41,220 |
| 11 | 11 | Ryder Supply Chain Solutions
|
4,612,000 | 166,000 | 41,900 | 70,700 | 43,500 |
| 12 | 12 | Estes Express Lines
|
4,447,000 | - | 21,700 | 8,500 | 34,000 |
| 13 | 13 | Hub Group
|
4,232,000 | 171,000 | 5,000 | 3,600 | 6,100 |
| 15 | 14 | Penske Logistics
|
3,700,000 | - | 19,994 | 5,583 | 13,771 |
| 14 | 15 | ArcBest
|
3,980,000 | 214,000 | 14,000 | 4,360 | 23,438 |
| 16 | 16 | NFI
|
3,100,000 | - | 15,500 | 4,600 | 13,000 |
| 17 | 17 | Werner Enterprises
|
2,734,000 | 259,000 | 13,525 | 8,775 | 27,225 |
| 20 | 18 | Prime Inc.
|
2,408,000 | 351,000 | 4,411 | 7,601 | 14,700 |
| 19 | 19 | R+L Carriers
|
2,427,000 est |
- | 6,774 | 19,709 | |
| 21 | 20 | Saia Inc.
|
2,300,000 | 335,000 | 12,000 | 5,600 | 19,300 |
| 23 | 21 | U.S. Xpress Enterprises
|
1,949,000 | 11,000 | 8,689 | 6,400 | 13,600 |
| 18 | 22 | Purolator
|
2,600,000 | 293,000 | 13,533 | 522 | 2,005 |
| 24 | 23 | Kenan Advantage Group
|
1,904,000 est |
- | 9,311 | 7,121 | 12,235 |
| 25 | 24 | CRST The Transportation Solution
|
1,800,000 | - | 6,536 | 4,894 | 14,289 |
| 29 | 25 | C.R. England
|
1,644,000 | - | 6,588 | 3,833 | 5,897 |
| 31 | 26 | Daseke Inc.
|
1,557,000 | 56,000 | 4,006 | 4,697 | 11,266 |
| 22 | 27 | Evans Delivery
|
2,050,000 | - | 650 | 9,000 | 3,000 |
| 26 | 29 | Universal Logistics Holdings
|
1,751,000 | - | 8,000 | 4,066 | 3,800 |
| 33 | 30 | UniGroup
|
1,499,000 | - | 835 | 2,889 | 4,767 |
| 34 | 31 | Day & Ross
|
1,489,000 | - | 8,400 | 4,600 | 9,150 |
| 30 | 32 | Anderson Trucking Service
|
1,567,000 | - | 2,325 | 2,588 | 7,082 |
| 27 | 33 | Forward Air
|
1,662,000 | 116,000 | 4,327 | 865 | 6,370 |
| 35 | 34 | Southeastern Freight Lines
|
1,476,000 | - | 8,490 | 2,788 | 8,060 |
| 38 | 35 | Ruan
|
1,227,820 | - | 5,500 | 3,475 | 8,210 |
| 32 | 36 | Averitt Express
|
1,532,000 | - | 9,000 | 5,090 | 15,071 |
| 37 | 37 | Crete Carrier Corp.
|
1,304,000 | - | 6,500 | 5,000 | 13,000 |
| 51 | 38 | Quality Carriers
|
850,000 | - | 1,600 | 2,600 | 7,500 |
| 39 | 39 | Lynden
|
1,080,000 | - | 2,472 | 880 | 2,430 |
| 36 | 40 | PS Logistics
|
1,375,000 | - | 3,100 | 3,625 | 5,700 |
| 48 | 41 | KLLM Transport Services
|
953,000 | - | 3,200 | 6,100 | |
| 46 | 42 | Marten Transport
|
974,000 | 85,000 | 4,007 | 3,204 | 5,299 |
| 40 | 43 | Central Transport International
|
1,046,000 est |
- | 2,953 | 11,877 | |
| 49 | 44 | 10 Roads Express
|
917,000 | - | 5,052 | 5,287 | |
| 44 | 45 | Cardinal Logistics
|
981,000 | - | 4,200 | 3,025 | 8,000 |
| 40 | 46 | Covenant Logistics Group
|
1,046,000 | - | 5,600 | 2,563 | 5,213 |
| 27 | 47 | OnTrac Inc.
|
1,662,000 est |
- | |||
| 50 | 48 | Pitt Ohio Transportation Group
|
900,000 | - | 5,087 | 1,565 | 3,995 |
| 46 | 49 | Atlas World Group
|
974,000 | 17,000 | 655 | 1,653 | 3,615 |
| 45 | 51 | Western Express
|
977,000 | - | 4,400 | 3,150 | 8,400 |
| 56 | 52 | United Road Services
|
713,000 est |
- | 1,837 | 1,978 | 2,110 |
| 54 | 53 | AAA Cooper Transportation
|
776,000 | - | 5,000 | 2,650 | |
| 42 | 54 | Bennett International Group
|
998,000 | - | 1,114 | 2,726 | 1,865 |
| 60 | 55 | Dayton Freight Lines
|
684,000 | 145,000 | 5,593 | 1,813 | 4,970 |
| 66 | 56 | Heartland Express
|
607,000 | 79,000 | 3,180 | 3,193 | 10,741 |
| 53 | 57 | Bison Transport
|
778,000 | - | 3,732 | 2,115 | 6,057 |
| 55 | 58 | Stevens Transport
|
745,000 | 129,000 | 2,900 | 2,050 | 3,600 |
| 59 | 59 | Canada Cartage System
|
701,000 | - | 4,332 | 2,880 | 2,700 |
| 52 | 60 | Mullen Group
|
838,000 | - | 4,622 | 2,241 | 6,151 |
| 67 | 61 | Trimac Transportation
|
600,000 est |
- | 1,681 | 3,250 | |
| 62 | 63 | Cowan Systems
|
655,000 | - | 2,301 | 2,346 | 7,487 |
| 68 | 64 | Heniff Transportation Systems
|
562,000 est |
- | 1,806 | 5,066 | |
| 57 | 65 | USA Truck (DB Schenker)
|
710,000 | 25,000 | 2,069 | 2,157 | 6,548 |
| 64 | 66 | Hirschbach Motor Lines
|
626,000 | - | 1,990 | 2,299 | 3,861 |
| 69 | 67 | Two Men and a Truck Movers
|
525,000 est |
- | 11,396 | ||
| 71 | 68 | Jack Cooper Holdings
|
507,000 est |
- | 3,753 | 1,286 | 1,284 |
| 63 | 69 | A. Duie Pyle Inc.
|
628,000 | - | 3,734 | 1,444 | 2,962 |
| 65 | 70 | Mercer Transportation Co.
|
614,000 | - | 247 | 2,180 | 2,180 |
| 58 | 71 | P.A.M. Transport
|
707,100 | 76,500 | 2,510 | 1,970 | 6,859 |
| 43 | 72 | IMC Cos.
|
983,000 | - | 2,371 | 1,700 | 150 |
| 70 | 73 | Roehl Transport
|
521,000 | - | 2,968 | 2,074 | 5,883 |
| 75 | 74 | TMC Transportation
|
450,000 est |
- | 3,098 | 4,252 | |
| 77 | 75 | Roadrunner Freight
|
430,000 est |
- | |||
| 76 | 76 | Foodliner/Quest Liner
|
437,000 | - | 1,562 | 1,608 | 2,914 |
| 72 | 77 | Fastfrate Group
|
500,000 | - | 3,000 | 1,152 | 1,644 |
| 73 | 78 | Mesilla Valley Transportation
|
494,000 | - | 2,616 | 1,796 | 6,000 |
| 79 | 79 | Maverick USA
|
398,000 | - | 1,977 | 1,458 | 2,671 |
| 81 | 80 | Dart Transit Co.
|
377,600 est |
- | 2,051 | 7,140 | |
| 93 | 81 | ContainerPort Group
|
287,000 | - | 363 | 1,296 | 16 |
| 78 | 82 | Challenger Motor Freight
|
402,000 | - | 1,200 | 1,545 | 3,380 |
| 61 | 83 | R&R Express
|
680,000 | - | 397 | 504 | 642 |
| 87 | 84 | John Christner Trucking
|
334,000 | 17,000 | 315 | 754 | 1,236 |
| 82 | 85 | Red Classic
|
365,000 | - | 1,206 | 649 | 3,500 |
| 85 | 86 | Koch Cos.
|
359,000 | - | 1,213 | 983 | 5,689 |
| 74 | 87 | Quantix Supply Chain Solutions
|
454,000 | -72,000 | 1,850 | 1,632 | 3,594 |
| 84 | 90 | Dupré Logistics
|
360,000 | 188,000 | 1,260 | 750 | 2,000 |
| 86 | 92 | Melton Truck Lines
|
338,000 | - | 1,611 | 1,233 | 2,191 |
| 80 | 94 | Daylight Transport
|
380,000 | - | |||
| 90 | 95 | Trans-System Inc.
|
315,000 | - | 990 | 940 | 1,886 |
| 98 | 99 | PGT Trucking
|
253,700 | - | 695 | 1,138 | 1,825 |
| 99 | 100 | Smith Transport
|
246,000 est |
- | 1,136 | 816 | 2,250 |
Top For-Hire Carriers on this list are common and contract freight carriers operating in the United States, Canada and Mexico. Companies are ranked on the basis of annual revenue. To be included in the Top 100 or any of the sectors, please send contact information to tteditor@ttnews.com. We will contact you via phone or e-mail to get information about your company prior to publication of the next Top 100 list.
Revenues for the following carriers are estimated by SJ Consulting Group: R+L Carriers, LaserShip/OnTrac, Crete Carrier Corp., Central Transport International, Oak Harbor Freight Lines.
FedEx Corp. revenue is for 12-month period ended Feb. 28, 2022.
Ruan revenue is for 2020.
10 Roads Express revenue is estimated by Culhane Meadows Pllc.
United Road Services revenue is for 2019.
Trimac revenue is for 2020.
Heniff Transportation Systems revenue is estimated for 2020.
Two Men and a Truck revenue is for 2019.
Jack Cooper Holdings revenue is estimated by SJ Consulting Group for 2019.
TMC Transportation revenue is for 2019.
Roadrunner Freight revenue is for 2019.
Dart Transit Co. revenue is estimated by SJ Consulting Group for 2020.
PGT Trucking revenue is for 2020.
Smith Transport revenue is for 2020.
* Tractor count includes company-owned, lease-to-own and owner-operator tractors.


Knight-Swift Reports Revenue, Earnings Decline for Q1
Knight-Swift Transportation Holdings Inc. experienced a year-over-year decline in revenue and earnings during the first quarter of 2023, the company reported April 20.
Amazon May Charge a Return Fee at UPS Stores

If you opt to return your Amazon purchase at a UPS store, that transaction just might cost you.
NFI Ramps Up Battery-Electric Truck Deployment in California
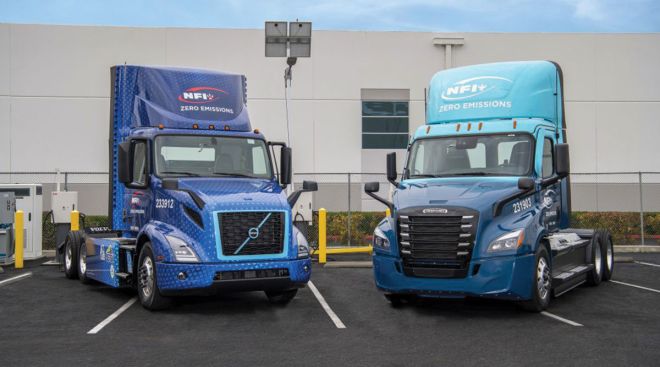
NFI Industries will deploy 50 Class 8 battery-electric trucks (BETs) in Southern California, the for-hire truckload carrier said.
April 18, 2023UPS, Teamsters Poised for Massive Contract Talks

High-stakes negotiations could start April 17 between the Teamsters and package delivery giant UPS that could have far-reaching reverberations.
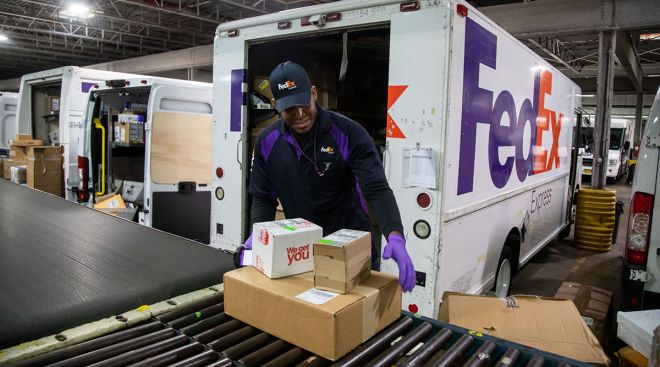
FedEx to Merge Ground, Express Units
FedEx Corp. will combine nearly all of its ground, air and other operations by June 2024 as part of a $4 billion cost-cutting initiative, the company announced April 5.
Penske Announces Kris-Way Truck Leasing Acquisition
Penske Truck Leasing announced March 30 that it has reached an agreement to acquire Kris-Way Truck Leasing Inc.
April 3, 2023RXO Opens New Cross-Border Facility in Texas
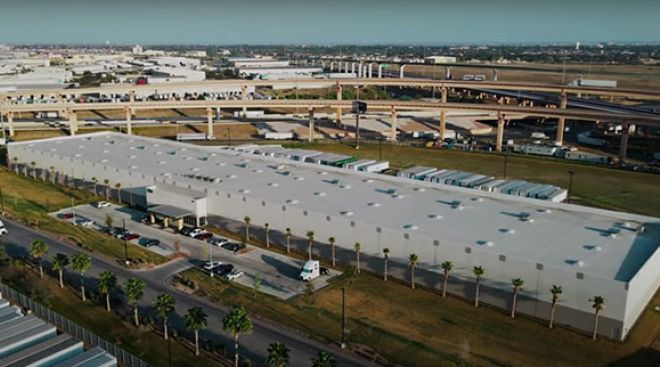
RXO celebrated the grand opening of its newest cross-border facility in Laredo, Texas, the company announced March 29.
February Trailer Orders Down 2.6% Year-Over-Year
U.S. trailer orders fell just shy of 26,000 units in February, falling short of the year-ago total, ACT Research reported.
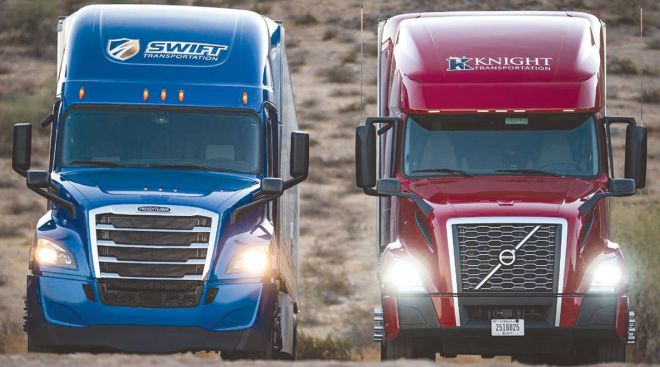
Knight-Swift Agrees to Acquire U.S. Xpress
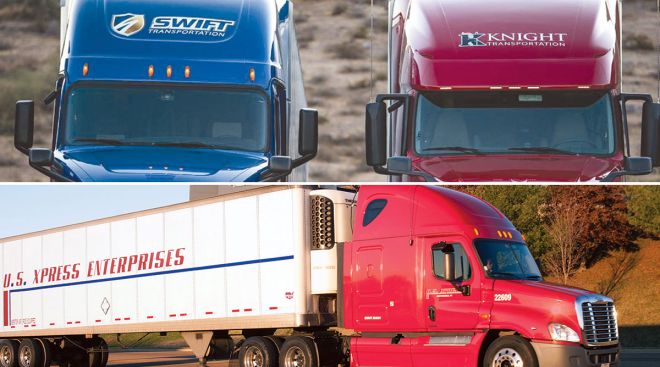
Knight-Swift Transportation Holdings has reached an agreement to acquire U.S. Xpress for approximately $808 million, the companies announced March 21.
FedEx Boosts Profit Forecast, Cites Cost Cuts as Effective
FedEx Corp.’s shares jumped the most in nine months after the courier boosted its profit outlook, signaling efforts to cut costs are helping counter a decline in package volume.
-

2022
-
2021
-
2020
-
2019
-
2018
-
2017
-
2016
-
2015
-
2014
-
2013
-
2012
-
2011
-
2010
-
2009
-
2008
-
2007
-
2006
-
2005
-
2004


