


| Rank This Year | Rank Last Year | Company | Revenue (000) | Net Income (000) | Employees | Tractors* | Trailers |
|---|---|---|---|---|---|---|---|
| 100 | Paper Transport
|
244,000 | - | 1,100 | 850 | 3,200 | |
| 99 | 100 | Smith Transport
|
246,000 est |
- | 1,136 | 816 | 2,250 |
| 98 | 99 | PGT Trucking
|
253,700 | - | 695 | 1,138 | 1,825 |
| 97 | Paschall Truck Lines
|
265,000 | - | 1,545 | 1,170 | 3,500 | |
| 96 | Artur Express
|
272,000 | - | 471 | 776 | 3,047 | |
| 95 | Transervice Logistics
|
278,300 | - | 1,200 | 366 | 2,181 | |
| 94 | Oak Harbor Freight Lines
|
284,000 est |
- | 1,700 | 777 | 2,487 | |
| 93 | 81 | ContainerPort Group
|
287,000 | - | 363 | 1,296 | 16 |
| 92 | New Legend Inc.
|
294,000 | 37,000 | 1,400 | 1,000 | 4,600 | |
| 91 | Beemac Trucking
|
301,000 | - | 130 | 525 | 610 | |
| 90 | 95 | Trans-System Inc.
|
315,000 | - | 990 | 940 | 1,886 |
| 89 | Western Flyer Express
|
320,000 | - | 1,150 | 4,000 | ||
| 88 | Leonard's Express
|
327,000 | - | 700 | 582 | 1,000 | |
| 87 | 84 | John Christner Trucking
|
334,000 | 17,000 | 315 | 754 | 1,236 |
| 86 | 92 | Melton Truck Lines
|
338,000 | - | 1,611 | 1,233 | 2,191 |
| 85 | 86 | Koch Cos.
|
359,000 | - | 1,213 | 983 | 5,689 |
| 84 | 90 | Dupré Logistics
|
360,000 | 188,000 | 1,260 | 750 | 2,000 |
| 83 | Dependable Supply Chain Services
|
363,000 | - | 1,965 | 462 | 1,167 | |
| 82 | 85 | Red Classic
|
365,000 | - | 1,206 | 649 | 3,500 |
| 81 | 80 | Dart Transit Co.
|
377,600 est |
- | 2,051 | 7,140 | |
| 80 | 94 | Daylight Transport
|
380,000 | - | |||
| 79 | 79 | Maverick USA
|
398,000 | - | 1,977 | 1,458 | 2,671 |
| 78 | 82 | Challenger Motor Freight
|
402,000 | - | 1,200 | 1,545 | 3,380 |
| 77 | 75 | Roadrunner Freight
|
430,000 est |
- | |||
| 76 | 76 | Foodliner/Quest Liner
|
437,000 | - | 1,562 | 1,608 | 2,914 |
| 75 | 74 | TMC Transportation
|
450,000 est |
- | 3,098 | 4,252 | |
| 74 | 87 | Quantix Supply Chain Solutions
|
454,000 | -72,000 | 1,850 | 1,632 | 3,594 |
| 73 | 78 | Mesilla Valley Transportation
|
494,000 | - | 2,616 | 1,796 | 6,000 |
| 72 | 77 | Fastfrate Group
|
500,000 | - | 3,000 | 1,152 | 1,644 |
| 71 | 68 | Jack Cooper Holdings
|
507,000 est |
- | 3,753 | 1,286 | 1,284 |
| 70 | 73 | Roehl Transport
|
521,000 | - | 2,968 | 2,074 | 5,883 |
| 69 | 67 | Two Men and a Truck Movers
|
525,000 est |
- | 11,396 | ||
| 68 | 64 | Heniff Transportation Systems
|
562,000 est |
- | 1,806 | 5,066 | |
| 67 | 61 | Trimac Transportation
|
600,000 est |
- | 1,681 | 3,250 | |
| 66 | 56 | Heartland Express
|
607,000 | 79,000 | 3,180 | 3,193 | 10,741 |
| 65 | 70 | Mercer Transportation Co.
|
614,000 | - | 247 | 2,180 | 2,180 |
| 64 | 66 | Hirschbach Motor Lines
|
626,000 | - | 1,990 | 2,299 | 3,861 |
| 63 | 69 | A. Duie Pyle Inc.
|
628,000 | - | 3,734 | 1,444 | 2,962 |
| 62 | 63 | Cowan Systems
|
655,000 | - | 2,301 | 2,346 | 7,487 |
| 61 | 83 | R&R Express
|
680,000 | - | 397 | 504 | 642 |
| 60 | 55 | Dayton Freight Lines
|
684,000 | 145,000 | 5,593 | 1,813 | 4,970 |
| 59 | 59 | Canada Cartage System
|
701,000 | - | 4,332 | 2,880 | 2,700 |
| 58 | 71 | P.A.M. Transport
|
707,100 | 76,500 | 2,510 | 1,970 | 6,859 |
| 57 | 65 | USA Truck (DB Schenker)
|
710,000 | 25,000 | 2,069 | 2,157 | 6,548 |
| 56 | 52 | United Road Services
|
713,000 est |
- | 1,837 | 1,978 | 2,110 |
| 55 | 58 | Stevens Transport
|
745,000 | 129,000 | 2,900 | 2,050 | 3,600 |
| 54 | 53 | AAA Cooper Transportation
|
776,000 | - | 5,000 | 2,650 | |
| 53 | 57 | Bison Transport
|
778,000 | - | 3,732 | 2,115 | 6,057 |
| 52 | 60 | Mullen Group
|
838,000 | - | 4,622 | 2,241 | 6,151 |
| 51 | 38 | Quality Carriers
|
850,000 | - | 1,600 | 2,600 | 7,500 |
| 50 | 48 | Pitt Ohio Transportation Group
|
900,000 | - | 5,087 | 1,565 | 3,995 |
| 49 | 44 | 10 Roads Express
|
917,000 | - | 5,052 | 5,287 | |
| 48 | 41 | KLLM Transport Services
|
953,000 | - | 3,200 | 6,100 | |
| 46 | 49 | Atlas World Group
|
974,000 | 17,000 | 655 | 1,653 | 3,615 |
| 46 | 42 | Marten Transport
|
974,000 | 85,000 | 4,007 | 3,204 | 5,299 |
| 45 | 51 | Western Express
|
977,000 | - | 4,400 | 3,150 | 8,400 |
| 44 | 45 | Cardinal Logistics
|
981,000 | - | 4,200 | 3,025 | 8,000 |
| 43 | 72 | IMC Cos.
|
983,000 | - | 2,371 | 1,700 | 150 |
| 42 | 54 | Bennett International Group
|
998,000 | - | 1,114 | 2,726 | 1,865 |
| 40 | 43 | Central Transport International
|
1,046,000 est |
- | 2,953 | 11,877 | |
| 40 | 46 | Covenant Logistics Group
|
1,046,000 | - | 5,600 | 2,563 | 5,213 |
| 39 | 39 | Lynden
|
1,080,000 | - | 2,472 | 880 | 2,430 |
| 38 | 35 | Ruan
|
1,227,820 | - | 5,500 | 3,475 | 8,210 |
| 37 | 37 | Crete Carrier Corp.
|
1,304,000 | - | 6,500 | 5,000 | 13,000 |
| 36 | 40 | PS Logistics
|
1,375,000 | - | 3,100 | 3,625 | 5,700 |
| 35 | 34 | Southeastern Freight Lines
|
1,476,000 | - | 8,490 | 2,788 | 8,060 |
| 34 | 31 | Day & Ross
|
1,489,000 | - | 8,400 | 4,600 | 9,150 |
| 33 | 30 | UniGroup
|
1,499,000 | - | 835 | 2,889 | 4,767 |
| 32 | 36 | Averitt Express
|
1,532,000 | - | 9,000 | 5,090 | 15,071 |
| 31 | 26 | Daseke Inc.
|
1,557,000 | 56,000 | 4,006 | 4,697 | 11,266 |
| 30 | 32 | Anderson Trucking Service
|
1,567,000 | - | 2,325 | 2,588 | 7,082 |
| 29 | 25 | C.R. England
|
1,644,000 | - | 6,588 | 3,833 | 5,897 |
| 27 | 33 | Forward Air
|
1,662,000 | 116,000 | 4,327 | 865 | 6,370 |
| 27 | 47 | OnTrac Inc.
|
1,662,000 est |
- | |||
| 26 | 29 | Universal Logistics Holdings
|
1,751,000 | - | 8,000 | 4,066 | 3,800 |
| 25 | 24 | CRST The Transportation Solution
|
1,800,000 | - | 6,536 | 4,894 | 14,289 |
| 24 | 23 | Kenan Advantage Group
|
1,904,000 est |
- | 9,311 | 7,121 | 12,235 |
| 23 | 21 | U.S. Xpress Enterprises
|
1,949,000 | 11,000 | 8,689 | 6,400 | 13,600 |
| 22 | 27 | Evans Delivery
|
2,050,000 | - | 650 | 9,000 | 3,000 |
| 21 | 20 | Saia Inc.
|
2,300,000 | 335,000 | 12,000 | 5,600 | 19,300 |
| 20 | 18 | Prime Inc.
|
2,408,000 | 351,000 | 4,411 | 7,601 | 14,700 |
| 19 | 19 | R+L Carriers
|
2,427,000 est |
- | 6,774 | 19,709 | |
| 18 | 22 | Purolator
|
2,600,000 | 293,000 | 13,533 | 522 | 2,005 |
| 17 | 17 | Werner Enterprises
|
2,734,000 | 259,000 | 13,525 | 8,775 | 27,225 |
| 16 | 16 | NFI
|
3,100,000 | - | 15,500 | 4,600 | 13,000 |
| 15 | 14 | Penske Logistics
|
3,700,000 | - | 19,994 | 5,583 | 13,771 |
| 14 | 15 | ArcBest
|
3,980,000 | 214,000 | 14,000 | 4,360 | 23,438 |
| 13 | 13 | Hub Group
|
4,232,000 | 171,000 | 5,000 | 3,600 | 6,100 |
| 12 | 12 | Estes Express Lines
|
4,447,000 | - | 21,700 | 8,500 | 34,000 |
| 11 | 11 | Ryder Supply Chain Solutions
|
4,612,000 | 166,000 | 41,900 | 70,700 | 43,500 |
| 10 | 8 | Yellow Corp.
|
5,122,000 | 104,000 | 32,000 | 14,200 | 42,000 |
| 9 | 10 | Old Dominion Freight Line
|
5,256,000 | 1,034,000 | 24,372 | 10,403 | 41,220 |
| 8 | 7 | Schneider
|
5,600,000 | 405,000 | 16,050 | 11,300 | 36,700 |
| 7 | 6 | Knight-Swift Transportation Holdings
|
6,000,000 | 966,000 | 27,900 | 21,351 | 75,019 |
| 6 | 9 | Landstar System
|
6,538,000 | 721,000 | 1,399 | 11,864 | 18,307 |
| 5 | 5 | TFI International
|
7,220,000 | 664,000 | 29,539 | 22,812 | 50,091 |
| 4 | 4 | J.B. Hunt Transport Services
|
12,168,000 | 760,800 | 34,978 | 18,617 | 39,994 |
| 3 | 3 | XPO
|
12,800,000 | 323,000 | 42,000 | 7,900 | 25,800 |
| 2 | 2 | FedEx Corp.
|
91,683,000 | 6,118,000 | 577,000 | 37,488 | 136,947 |
| 1 | 1 | UPS Inc.
|
97,300,000 | 12,900,000 | 534,000 | 15,554 | 85,398 |
Top For-Hire Carriers on this list are common and contract freight carriers operating in the United States, Canada and Mexico. Companies are ranked on the basis of annual revenue. To be included in the Top 100 or any of the sectors, please send contact information to tteditor@ttnews.com. We will contact you via phone or e-mail to get information about your company prior to publication of the next Top 100 list.
Revenues for the following carriers are estimated by SJ Consulting Group: R+L Carriers, LaserShip/OnTrac, Crete Carrier Corp., Central Transport International, Oak Harbor Freight Lines.
FedEx Corp. revenue is for 12-month period ended Feb. 28, 2022.
Ruan revenue is for 2020.
10 Roads Express revenue is estimated by Culhane Meadows Pllc.
United Road Services revenue is for 2019.
Trimac revenue is for 2020.
Heniff Transportation Systems revenue is estimated for 2020.
Two Men and a Truck revenue is for 2019.
Jack Cooper Holdings revenue is estimated by SJ Consulting Group for 2019.
TMC Transportation revenue is for 2019.
Roadrunner Freight revenue is for 2019.
Dart Transit Co. revenue is estimated by SJ Consulting Group for 2020.
PGT Trucking revenue is for 2020.
Smith Transport revenue is for 2020.
* Tractor count includes company-owned, lease-to-own and owner-operator tractors.


Trucking Industry Reports Predictably Weak Q2
The trucking industry reported a weak second quarter with freight volumes and destocking efforts putting downward pressure on demand.
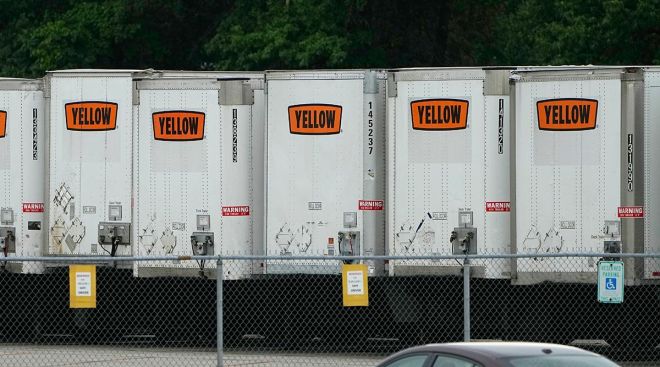
Yellow Might Get Loan From Fellow Trucking Fleet to Pay Debts
Yellow Corp. has sparked a bidding war between investment firms and a rival trucking company interested in funding the now-shuttered company’s liquidation.
August 9, 2023Searches for UPS Jobs Soar Following Union Deal
UPS Inc. has become a hot employer since its union last month secured $30 billion in new money over a five-year contract.
UPS Lost More Business Than Expected on Strike Threat
Profits at UPS fell year-over-year in the second quarter as the parcel carrier lost more business to rivals than expected due to uncertainty surrounding negotiations with the Teamsters.
Yellow Files for Chapter 11 Bankruptcy
Yellow Corp. on Aug. 7 announced it was seeking Chapter 11 bankruptcy protection and entering into an agreement that would secure sufficient financing to wind down operations.
XPO Reports Q2 Income, Revenue Decline
XPO saw second-quarter net income and revenue decline, but the company sees momentum headed into the third quarter.
Yellow Closure Reshuffles LTL Sector
Less-than-truckload carrier Yellow Corp.'s ceasing of operations on July 30 after nearly 100 years in business is causing an upheaval for both its customers and the broader LTL market.
Schneider Sees Drop in Q2 Earnings
Schneider National on Aug. 3 announced that both income and revenue fell during the second quarter.
Schneider Acquires M&M Transport
Schneider National Inc. announced that it is acquiring dedicated contract carrier M&M Transport Services.
TFI Q2 Profit Dips by More Than 50% on Lower Freight Volumes
Profits at TFI International Inc. more than halved in the second quarter of 2023 to $128.2 million from $276.8 million in the year-ago period, the company said.
-

2022
-
2021
-
2020
-
2019
-
2018
-
2017
-
2016
-
2015
-
2014
-
2013
-
2012
-
2011
-
2010
-
2009
-
2008
-
2007
-
2006
-
2005
-
2004


