


| Rank This Year | Rank Last Year | Company | Revenue (000) | Net Income (000) | Employees | Tractors* | Trailers |
|---|---|---|---|---|---|---|---|
| 43 | 37 | Jack Cooper Holdings
|
790,000 | - | 3,500 | ||
| 60 | 70 | Acme Truck Line
|
487,208 | - | 3,000 | 2,007 | 2,257 |
| 77 | 73 | Comcar Industries
|
315,972 | - | 2,409 | 1,937 | 4,226 |
| 94 | 86 | Fastfrate Group
|
222,960 | - | 710 | 504 | 1,371 |
| 44 | 39 | Day & Ross
|
771,988 | - | 1,602 | 1,552 | 3,103 |
| 61 | 54 | TransX Group of Companies
|
482,571 | - | 2,560 | 1,505 | 4,240 |
| 78 | 77 | Challenger Motor Freight
|
300,130 | - | 1,900 | 1,640 | 3,300 |
| 95 | 96 | Quantix Supply Chain Solutions
|
222,000 | - | 1,100 | 750 | 1,400 |
| 28 | 27 | Southeastern Freight Lines
|
1,171,968 | - | 8,299 | 3,599 | 11,496 |
| 45 | 40 | Trimac Transportation
|
737,725 | - | 3,262 | 2,167 | 4,679 |
| 62 | 58 | Shevell Group
|
461,000 | - | 3,559 | 1,920 | 4,600 |
| 79 | 84 | Koch Cos.
|
285,000 | - | 980 | 839 | 4,584 |
| 95 | 108 | Martin Transportation Systems
|
222,000 | - | 1,551 | 930 | 1,800 |
| 29 | 32 | Penske Logistics
|
1,137,000 | - | 13,000 | 2,054 | 4,918 |
| 63 | 76 | Bennett Family of Cos.
|
436,024 | - | 772 | 1,408 | 1,418 |
| 80 | 88 | Dependable Supply Chain Services
|
282,000 | - | 1,777 | 496 | 1,130 |
| 97 | 93 | Calyx Transportation Group
|
218,198 | - | 500 | 750 | |
| 30 | 26 | NFI
|
1,105,000 | - | 8,000 | 2,264 | 7,500 |
| 64 | 65 | Dayton Freight Lines
|
436,000 | - | 3,610 | 1,228 | 3,109 |
| 98 | 105 | Navajo Express Inc.
|
218,000 | - | 1,300 | 1,000 | 1,800 |
| 15 | 16 | Estes Express Lines
|
2,173,000 | - | 15,815 | 6,620 | 24,592 |
| 49 | 60 | Daseke Inc. (TFI)
|
668,000 | - | 2,500 | 2,610 | 5,515 |
| 82 | 69 | Graebel Moving and Workplace Solutions
|
270,000 | - | 2,000 | 420 | 800 |
| 99 | 103 | Central Freight Lines
|
214,000 | - | 1,448 | 6,648 | |
| 32 | 30 | Crete Carrier Corp.
|
1,100,000 | - | 5,500 | 5,130 | 12,883 |
| 66 | 67 | Cowan Systems
|
421,515 | - | 1,700 | 1,748 | 3,795 |
| 83 | 91 | Trans-System
|
262,627 | - | 965 | 924 | 1,463 |
| 33 | 29 | Averitt Express
|
1,078,000 | - | 4,441 | 13,075 | |
| 51 | 49 | AAA Cooper Transportation
|
580,371 | - | 4,500 | 2,450 | 6,000 |
| 84 | 94 | Paschall Truck Lines
|
261,211 | - | 1,150 | 3,000 | |
| 18 | 18 | U.S. Xpress Enterprises
|
1,730,000 | - | 7,770 | 17,000 | |
| 52 | 60 | Pitt Ohio
|
551,300 | - | 3,140 | 812 | 2,037 |
| 68 | 81 | Evans Delivery
|
400,000 | - | 275 | 3,150 | 525 |
| 19 | 17 | UniGroup
|
1,700,000 | - | 1,150 | 5,001 | 8,500 |
| 53 | 57 | Mercer Transportation
|
547,269 | - | 325 | 2,189 | 2,189 |
| 69 | 66 | Roehl Transport
|
395,971 | - | 2,500 | 2,255 | 4,090 |
| 87 | 91 | Groendyke Transport
|
241,313 | - | 1,423 | 975 | 1,500 |
| 20 | 23 | Kenan Advantage Group
|
1,567,453 | - | 7,265 | 6,455 | 9,448 |
| 54 | 57 | Western Express
|
540,104 | - | 3,107 | 2,404 | 5,700 |
| 71 | 68 | Mesilla Valley Transportation
|
372,000 | - | 1,700 | 1,300 | 4,800 |
| 88 | 106 | Black Horse Carriers
|
238,000 | - | 1,965 | 950 | 2,800 |
| 38 | 41 | Anderson Trucking Service
|
873,432 | - | 1,389 | 2,519 | 6,127 |
| 55 | 74 | United Road Services
|
532,000 | - | 1,700 | 1,772 | |
| 72 | 79 | California Cartage Co.
|
368,700 | - | 1,200 | ||
| 89 | 107 | Transport Investments
|
237,068 | - | 115 | 755 | 1,101 |
| 22 | 19 | Purolator
|
1,524,071 | - | 11,500 | 489 | 1,286 |
| 56 | 51 | Canada Cartage
|
516,976 | - | 2,543 | 2,417 | |
| 90 | 102 | Melton Truck Lines
|
236,000 | - | 1,378 | 1,107 | 1,837 |
| 23 | 20 | C.R. England
|
1,517,290 | - | 7,385 | 4,087 | 5,923 |
| 40 | 42 | KLLM Transport Services
|
863,000 | - | 3,800 | 5,500 | |
| 57 | 52 | Mullen Group
|
516,878 | - | 2,092 | 1,374 | 3,529 |
| 74 | 83 | Cassens Transport
|
328,649 | - | 1,445 | 1,371 | |
| 90 | 104 | IMC Logistics
|
236,000 | - | 1,522 | 1,037 | 88 |
| 7 | 7 | Schneider
|
3,900,000 | - | 17,450 | 12,300 | 32,350 |
| 24 | 15 | Sirva
|
1,464,400 | - | 2,700 | 2,609 | 4,263 |
| 41 | 38 | Ruan
|
848,759 | - | 5,595 | 3,754 | 8,395 |
| 58 | 54 | Suddath
|
500,000 | - | 2,000 | 384 | 754 |
| 75 | 82 | A. Duie Pyle
|
318,811 | - | 2,500 | 822 | 1,900 |
| 92 | 109 | Dicom Transportation Group
|
230,874 | - | 1,200 | 812 | 450 |
| 25 | 24 | CRST The Transportation Solution
|
1,351,571 | - | 5,129 | 4,394 | 7,290 |
| 59 | 55 | Bison Transport
|
398,990 | - | 2,321 | 1,502 | 3,857 |
| 93 | 98 | Brown Integrated Logistics
|
224,655 | - | 1,104 | 1,047 | 5,100 |
| 5 | 5 | Yellow Corp.
|
5,068,800 | -67,700 | 33,000 | 6,400 | 13,000 |
| 14 | 43 | XPO
|
2,356,600 | -63,600 | 10,000 | 6,200 | |
| 65 | 61 | Dart Transit Co.
|
425,503 | 3,854 | 1,365 | 1,875 | 5,789 |
| 50 | 51 | USA Truck
|
602,477 | 6,285 | 2,183 | 6,216 | |
| 100 | 95 | Wheaton World Wide Moving
|
210,527 | 6,945 | 180 | 717 | 1,075 |
| 85 | 89 | Superior Bulk Logistics
|
260,200 | 7,600 | 1,416 | 1,189 | 2,099 |
| 37 | 36 | Atlas World Group
|
878,313 | 9,542 | 644 | 2,086 | 4,012 |
| 67 | 63 | P.A.M. Transport
|
410,937 | 13,491 | 2,911 | 1,761 | 4,919 |
| 81 | 88 | John Christner Trucking
|
271,104 | 15,033 | 213 | 733 | 1,184 |
| 46 | 44 | Covenant Logistics Group
|
718,980 | 17,808 | 4,400 | 2,665 | 6,722 |
| 36 | 34 | Quality Carriers
|
991,758 | 20,640 | 1,188 | 3,195 | 3,171 |
| 76 | 80 | Maverick USA
|
316,018 | 21,044 | 1,813 | 1,376 | 1,983 |
| 73 | 79 | Epes Carriers Inc.
|
341,494 | 24,001 | 1,359 | 1,121 | 5,500 |
| 42 | 45 | Celadon Group Inc.
|
806,400 | 35,579 | 4,582 | 4,031 | 11,180 |
| 27 | 28 | Universal Logistics Holdings
|
1,191,521 | 45,370 | 4,218 | 4,408 | 6,291 |
| 8 | 8 | Hub Group
|
3,571,126 | 51,558 | 2,568 | 2,977 | 448 |
| 17 | 21 | Roadrunner Freight
|
1,872,816 | 51,974 | 4,142 | 4,170 | 5,135 |
| 26 | 25 | Saia Inc.
|
1,272,321 | 51,991 | 8,900 | 3,780 | 11,530 |
| 34 | 47 | Forward Air
|
1,010,959 | 61,169 | 3,600 | 1,300 | 3,100 |
| 39 | 33 | Heartland Express
|
871,355 | 84,834 | 4,500 | 4,776 | 12,970 |
| 47 | 47 | Stevens Transport
|
673,160 | 91,310 | 2,835 | 2,775 | 3,782 |
| 16 | 14 | Werner Enterprises
|
2,139,289 | 98,650 | 10,664 | 7,105 | 22,305 |
| 31 | 31 | Knight-Swift Transportation Holdings
|
1,102,332 | 102,862 | 5,526 | 4,738 | 11,487 |
| 13 | 11 | Ryder System
|
2,461,149 | 122,356 | 4,098 | 6,042 | |
| 4 | 4 | Con-way Inc.
|
5,806,069 | 137,039 | 30,100 | 12,100 | 33,300 |
| 10 | 10 | Landstar System
|
3,184,790 | 138,809 | 1,211 | 8,662 | 13,732 |
| 9 | 9 | TFI International
|
3,363,213 | 138,902 | 16,050 | 14,980 | 18,680 |
| 6 | 6 | Swift Transportation
|
4,298,724 | 161,151 | 21,274 | 18,836 | 61,652 |
| 21 | 22 | Prime Inc.
|
1,563,413 | 207,436 | 4,450 | 6,187 | 10,637 |
| 11 | 12 | Old Dominion Freight Line
|
2,787,897 | 267,514 | 18,804 | 6,907 | 27,635 |
| 3 | 3 | J.B. Hunt Transport Services
|
6,165,441 | 374,792 | 20,158 | 12,995 | 27,731 |
| 2 | 2 | FedEx Corp.
|
47,100,000 | 2,532,000 | 325,000 | 26,594 | 97,469 |
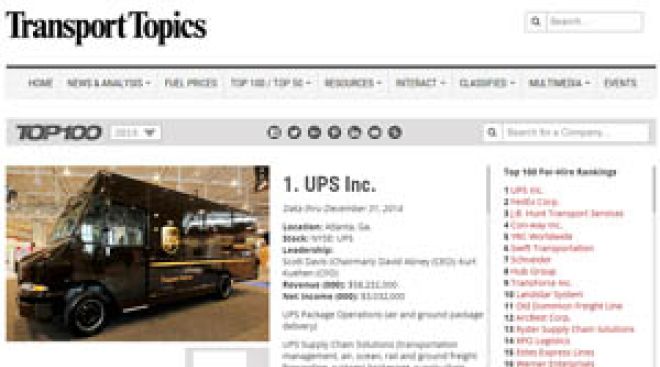
| 1 | 1 | UPS Inc.
|
58,232,000 | 3,032,000 | 435,000 | 106,000 |
Top For-Hire Carriers on this list are common and contract freight carriers operating in the United States, Canada and Mexico. Companies are ranked on the basis of annual revenue. To be included in the Top 100 or any of the sectors, please send contact information to tteditor@ttnews.com. We will contact you via phone or e-mail to get information about your company prior to publication of the next Top 100 list.
* Tractor count includes company-owned, lease-to-own and owner-operator tractors.
On the Bubble
TFI to Put LTL, Truckload Units on Diets as Q2 Profit Falls

TFI International is cutting costs across both its Less-Than-Truckload and Truckload businesses amid what CEO Alain Bédard described as a stubbornly lackluster freight environment.
Ryder Posts Q2 Profit Surge, Revenue Up 10% on Leasing Gains

Profits and revenues at Ryder System Inc. increased in the second quarter of 2024 on the back of higher returns from its leasing and maintenance program, the integration of the Cardinal Logistics acquisition and the absence of an accounting charge taken in the year-ago period.
Knight-Swift CEO Cautiously Optimistic as Q2 Results Stabilize

Knight-Swift Transportation Holdings reported July 24 that revenue reached just shy of $2 billion in the second quarter of 2024. The Phoenix-based carrier posted net income attributable to itself of $20.3 million.
Covenant Logistics Reports Nearly 5% Revenue Rise for Q2

Covenant Logistics Group experienced an increase in revenue but a slight decline in earnings during the second quarter of 2024, the company reported July 24.
Old Dominion Posts Third Straight Quarter of Revenue Growth

Old Dominion Freight Line marked its third consecutive quarter of year-over-year revenue growth during the second quarter of 2024, the company reported July 24.
Gaining Driver Buy-In Is Key to Deploying Dash Cams

CHICAGO — Fleet operators are increasingly embracing the use of dash cameras, but successfully deploying these in-cab systems hinges on driver acceptance of the technology.
UPS Discusses Acquisition of Parcel Carrier in Mexico

The recently announced UPS acquisition of Mexican express delivery company Estafeta takes advantage of a business trend toward nearshoring.
Urban Delivery Hubs Present Solutions to Final-Mile Shipping

An evolving concept to address the issue of final-mile delivery is the urban delivery hub.
UPS Boosts Volume in US for First Time Since 2022

UPS boosted its volume in the U.S. for the first time since 2022 during its second quarter, but profit and revenue fell short of Wall Street expectations, partly due to a hefty charge.
XPO Launches Cross-Border Expansion Into Mexico

XPO launched a new service aimed at expanding its cross-border services between the U.S. and Mexico, the company announced July 17.
-

2023
-
2022
-
2021
-
2020
-
2019
-
2018
-
2017
-
2016
-
2015
-
2014
-
2013
-
2012
-
2011
-
2010
-
2009
-
2008
-
2007
-
2006
-
2005
-
2004


