


State Freight Plans Don't Reflect Uniform Metrics, Expert Says

WASHINGTON — State freight plans indicate various levels of detail regarding the ways freight is discussed and measured, according to a transportation expert from Northwestern University.
Lama Bou Mjahed, a postdoctoral fellow at Northwestern’s Transportation Center, conducted a project examining how states responded to the Fixing America’s Surface Transportation Act. The FAST Act, signed in December 2015, required states to develop their own freight plans. However, the act did not list specifications regarding metrics for measuring freight.
Also at TRB: Innovation in DOTs Often Starts With On-the-Ground Employees
Bou Mjahed, who delivered her findings at the Transportation Research Board’s annual meeting Jan. 16, collected all the available state freight plans that had been submitted by December 2017. She studied the plans, a total of 42, and looked at whether they reflected performance measures, considered multimodal factors, addressed supply chain needs and included the role of the private sector.
In particular, Bou Mjahed focused on highways, railroads and waterways. She found that discussions within states regarding multiple modes of transportation were more prevalent than measurements assessing multimodal issues. She said that 52% of state freight plans described multimodal discussions and 33% included multimodal measurements. Only Iowa included measured performances for all three modes.
“Performance measures are really critical for freight planning,” Bou Mjahed said.
The state plans considered various aspects of freight performance. For example, they examined reliability in terms of truck travel times, safety in the context of accidents and congestion in terms of delays. Bou Mjahed noted that states’ plans reflected roads more than rail and waterways because the latter two modes tend to be managed by private entities.
“Overall, we can confidently say that states address highways more than other modes,” Bou Mjahed said.
Safety and congestion were considered across all three modes. Bou Mjahed pointed out that this likely is because crash data is relatively easy to find. States used figures from sources such as the National Performance Management Research Data Set, which is maintained by the Federal Highway Administration. Bou Mjahed said she didn’t see any states that had purchased private data to study.
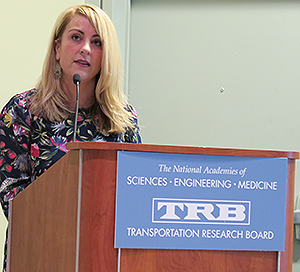
Nicole Blackwell Katsikides delivers the results of her study on freight fluidity in Texas. (Eleanor Lamb/Transport Topics)
Establishing a dialogue with private-sector partners is key to cultivating data, according to Nicole Blackwell Katsikides, an associate research scientist at the Texas A&M Transportation Institute. Katsikides, who previously held a leadership role at the Maryland Department of Transportation, recommended the Marines and the Army Corps of Engineers as resources for data, particularly regarding shipping and ports.
Reliability and resilience appeared harder for states to measure, according to Bou Mjahed. There are no agreed-upon metrics for resilience across the states.
Bou Mjahed said the most thorough state freight plans included measures that were understandable to constituents and lawmakers and drew from timely data. She also said a good technique is reporting trend analyses, which Minnesota did with highway incidents.
“Planning in 2014 with 2010 data wouldn’t be a good practice,” Bou Mjahed said. “It’s important to invest in data sets to get a more complete picture.”
During the panel, Katsikides delivered the results of her study on freight fluidity in Texas. Freight fluidity refers to measuring freight movement from a supply chain perspective.
ATRI Cost of Congestion to the Trucking Industry 2018 Update 10 2018 by Transport Topics on Scribd
Texas’ population is rapidly growing, and Katsikides’ study focused on three major metropolitan areas: Dallas-Fort Worth, Houston and El Paso. Texas saw the largest congestion cost increase between 2015 and 2016 of any state, according to an analysis published by the American Transportation Research Institute in October. Texas’ total congestion cost in 2016 was more than $6 billion.
Katsikides said that, in examining Texas’ economic statistics and GPS data, she was able to understand where travel issues occurred based on trips through certain areas over time. She said these findings can be used to shape projects to address freight needs in the future.
“We can use this information to prioritize freight projects,” Katsikides said. “We can better identify freight solutions.”