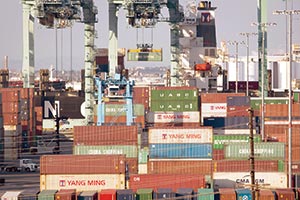
Ports Set Records for Containers in 2016; Forecast Better for 2017 Amid Uncertainty

This story appears in the Jan. 23 print edition of Transport Topics.
For several top North American container ports 2016 was a record-setting year, and industry analysts are cautiously optimistic that 2017 will be even better despite the uncertainty in Washington that comes with a new presidential administration.
The Port of Los Angeles set a new record for the busiest year at a container port. Its terminals handled 8,856,782 industry-standard 20-foot-equivalent units, or TEUs, in 2016, an 8.5% gain from the 8,160,458 TEUs in 2015.
“The year definitely ended much better than we had forecast,” said Daniel Hackett of Hackett Associates, author of the National Retail Federation’s monthly Global Port Tracker report.
Simon Heaney, senior manager of supply chain research at maritime consultancy firm Drewry, likened 2016 to a sports game. The early part of the year belonged to shippers with weak demand, and low fuel prices and freight rates, but after the bankruptcy of Hanjin Shipping Co., carriers benefited from tighter capacity, higher fuel prices and better rates.
“The general trend has been upwards ever since then, and the momentum has carried on through to the first couple weeks of 2017,” Heaney said.
But the Port of Long Beach, California, the second-largest on container volume, suffered a down year in 2016. For the full year, Long Beach container terminals processed 6,775,171 TEUs, a 5.8% drop from the 7,192,066 in 2015.
Seoul, South Korea-based Hanjin’s bankruptcy accounted for about 12.3% of the total volume in Long Beach compared with 4% in Los Angeles, according to Datamyne information logged from January to August 2016.
The collapse created a vacuum at Total Terminals International, a Hanjin majority-owned subsidiary operating at Pier T in Long Beach and Terminal 46 in Seattle. Hanjin sold Total Terminals to Mediterranean Shipping Co.’s terminal operating subsidiary Terminal Investment Ltd. for $133 million — approved by a U.S. bankruptcy court on Jan. 18. Terminal Investment paid $78 million for the two terminals and forgave $54.6 million in Hanjin debt owed to Total Terminals for terminal services. The proceeds will be sent to South Korea as part of the bankruptcy process.
Meanwhile, No. 7 Port of Virginia set a record for containerized volume with 2,655,705 TEUs, a 4.2% increase from 2015.
The Port of Oakland, California, No. 9, benefited from a 4% increase from 2015, processing 2,369,641 TEUs. It was the third-largest total in port history, only slightly behind the record of 2,394,069 in 2014.
The Port of Charleston, South Carolina, No. 11, broke a record at more than 1,996,000 TEUs, up 1.2% compared with 2015, according to the South Carolina Ports Authority.
The ports of New York-New Jersey (No. 3), Savannah, Georgia (4), Seattle-Tacoma (5) and Houston (10) had not reported final yearly totals at the time of publication.
Drewry predicts that worldwide container demand will rise 2% in 2017, and freight rates will increase 14% on east-west routes between Asia, Europe and North America.
But these positive outlooks don’t necessarily correlate directly to better results at individual ports, according to industry analysts.
“They are, of course, important for the individual ports, but when [the Port of New York-New Jersey] is down by 2.5% versus growth at Virginia … the total of all East Coast container trade has to be considered to view the whole picture. The same is true for the total volumes of L.A. and Long Beach,” said Scudder Smith, principal consultant on freight and logistics at Parsons Brinckerhoff, an engineering and consulting firm with a port, intermodal and maritime planning practice.
Hackett also cautioned that there are several political unknowns in the next two years, such as changes in U.S. trade policy or infrastructure spending, that could affect the forecasts.
House Speaker Paul Ryan and Kevin Brady, chairman of the Ways and Means Committee, have proposed a 20% value-added tax on all imports and exemptions on export-related revenue.
“The dollar will strengthen, and a 20% border adjustment would yield a 25% appreciation in the U.S. dollar, which would make imports cheaper and allow firms to be able to afford the additional tax. The net effect for the businesses should be zero,” Alex Brill, CEO of Matrix Global Advisors, said on a conference call with investment bank William Blair & Co.
A stronger dollar means that one can purchase more foreign currency. For example, $1 strengthens when it can be exchanged for 21 Mexican pesos previously but now gets 30 pesos. As a result, import costs drop.
However, Paul Bingham, vice president of the trade and logistics practice at the Economic Development Research Group, counters that the strength of the U.S. dollar depends on many variables and doesn’t work as smoothly as the supporters contend.
“Any reduction in the level of international trade versus domestic economic activity can result in an overall reduction in the use of freight transportation services, as goods consumed don’t have to make it to and from the country’s border,” Bingham said. “The aggregate reduced length of haul would likely not be good for the trucking industry, although there would be winners and losers within trucking.”

