Staff Writer
NHTSA Reports Spike in Large-Truck Occupant Fatalities

Department of Transportation officials centered on an optimistic but guarded message Oct. 3: Roadway fatalities were down 2% year-over-year in 2017, but that did not necessarily indicate an across-the-board trend.
During a teleconference to release the National Highway Traffic Safety Administration’s Fatality Analysis Reporting System numbers, they cautioned against thinking the decline pointed necessarily to a trend. Instead, NHTSA Administrator Heidi King illustrated a nuanced problem with no single solution.

King
“There is no denying that the data tell us an important part of the story,” King said. “But sometimes a public safety problem emerges before we develop robust national statistics.”
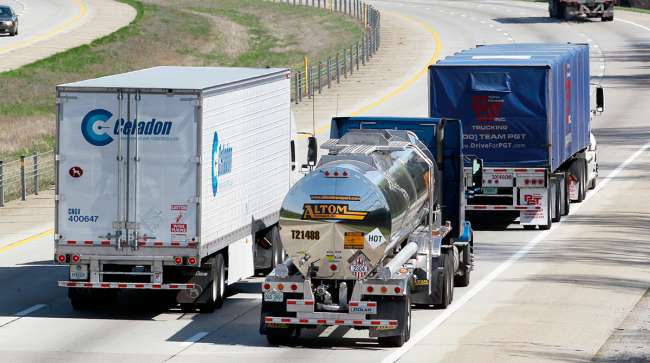
Federal Motor Carrier Safety Administration chief Ray Martinez pointed to large-truck occupant fatalities as a category that needed more research. That figure jumped 16% from 2016 to 2017 — from 725 to 841 fatalities — with approximately 40% of these occupants not wearing seat belts, despite continued efforts to educate on the issue, Martinez said.

Martinez
FARS defines a large truck as having a gross weight of more than 10,000 pounds, which includes noncommercial, intrastate-restricted trucks that may not necessarily fall under FMCSA regulations, and commercial, interstate-operated trucks that do. For the category of trucks between 10,000 and 14,000 pounds, the number involved in fatal crashes doubled from 2016 to 2017. And trucks exceeding 26,000 pounds were involved in 126 more fatal crashes in 2017 than in 2016 (a 3.8% increase), Martinez said.
“As a result of the continued strengthening of the U.S. economy, more vehicles — particularly commercial trucks — are traveling the nation’s roadways,” Martinez said. “For example, USDOT’s Freight Transportation Services Index, which is based on the amount of freight carried by the for-hire transportation industry, rose 4% in June from May, rising for the second consecutive month, to reach an all-time high. It is somewhat of a corollary that as the economy grows, more vehicle miles will be traveled … and the potential for crashes, injuries does increase.”
Martinez explained that his agency needed more time with the numbers to drill down on how many of the fatalities involved vehicles regulated by FMCSA. As it stands, the agency cannot identify precise causes for the rise, he said.
Likewise, the overall decline cannot be attributed to one solution, said Umesh Shankar, chief of data reporting and information division of NHTSA’s National Center for Statistics and Analysis. But educational campaigns — such as one about drug-impaired driving that NHTSA kicked off last month — and emerging technologies have helped.
2017 Fatal Motor Vehicle Crashes: Overview by Transport Topics on Scribd
“There are many factors that contributed to the 2017 decrease,” Shankar said. “However, there is no single reason.”
Alcohol-related auto fatalities declined 1.1% from 2016 to 2017, with Florida experiencing the largest decrease nationwide: 66 fewer deaths than in the prior year. On the opposite end of that spectrum, 67 more people died in Michigan due to alcohol-related vehicle incidents compared with the year before — the largest increase in the country.
The number of unbelted passenger occupant fatalities decreased by 4.2% year-over-year, from 10,514 to 10,076. Speeding-related fatalities declined by 5.6%; motorcycle fatalities declined by 3.1%; and van occupant fatalities declined by 5.8%.
Over the past decade, auto fatalities in urban areas have increased by 17.4%, while those in rural areas decreased by 18% in the same time period. Those figures include passenger vehicle occupants, pedestrians, pedal cyclists and motorcyclists.
In all, 37,133 people died in auto crashes in 2017.

