March Tonnage Up 0.7%
This story appears in the April 24 print edition of Transport Topics.
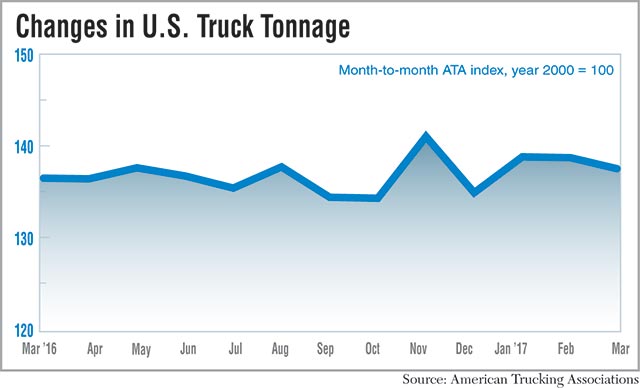
American Trucking Associations’ tonnage index rose 0.7% last month compared with March 2016, one of several figures pointing to a better market than a year ago but not as good as this February.
The tonnage index dropped 1% in March on a sequential basis, the second straight decline.
The preliminary seasonally adjusted index was 137.5 in March versus 138.8 in February. In March 2016, the number was 136.5. The index uses a base level of 100 for freight activity in the year 2000.
“Despite last month’s dip, seasonally adjusted tonnage rose 1.2% during the first quarter overall from the previous quarter and increased 0.2% from the same quarter last year,” ATA Chief Economist Bob Costello said.
The not seasonally adjusted index, which represents the change in tonnage actually hauled by the fleets, was 143.9 in March, 15% higher than in February.
The DAT North American Freight Index was 489 in March, up 58% from 2016 levels. DAT uses a base level of 100 for spot market activity in the year 2000.
The average national spot market rates for dry and refrigerated vans rose a penny to $1.63 per mile and $1.87 per mile in March, respectively, compared with February. The average flatbed rate increased 6 cents to $2.03.
“Rates rose in the last week of March, as shippers rushed freight out to end the quarter on a high note, but that was not enough to offset soft market conditions from early March,” said Don Thornton, DAT senior vice president.
Demand for flatbed trucking remained strong in the construction and energy sectors. The flatbed load-to-truck ratio rose to 36.6, a measurement of the number of loads for each truck listed as available. The dry van load-to-truck ratio was 3.2. The refrigerated van ratio was 6.2. In March 2016, the ratios were 17.6 for flatbed, 1.6 for dry van and 3.1 in refrigerated.
DAT defines a ratio benefiting carriers as anything greater than 18 for flatbed, 5.5 for dry van and 12 for refrigerated.
The Market Demand Index, a measure of loading activity from Truckstop.com, was 25.5 for the 15th week of the year versus 12.5 in the same week of 2016. Since March 1, the index fluctuated between 21 and 26. A number less than 15 denotes a market that favors shippers and more than 20 favors trucking.
“The market is once again turning in a truckers’ direction. We had a little bit of weakness right after the beginning of the year. But in early March, things really started to make incremental movements towards a truckers’ position [as far as demand and rates],” said Jon Starks, FTR chief operating officer.
The FTR Trucking Conditions Index was 5.11 in February, the latest month of data available. While it’s up sequentially from 2.67, it’s down from 8.27 one year ago. The index takes into account several variables, including fuel prices, rates and demand. Anything above zero is a positive environment. Double-digit figures indicate a significant change in operating environments.
“Dry van had a soft spell in January and February. Since then, it’s recovered pretty well. It’s been much stronger over the last four or five weeks. Refrigerated has been very similar to dry van,” Starks said. “Flatbed had strong improvements in the very latter portion of 2016, and it’s been running reasonably strong this year. However, it has been running at pace with normal flatbed activity.”
Other economic indicators affecting the freight marketplace were generally mixed in March.
The Institute for Supply Management manufacturing index was 57.2 in March versus 57.7 in February. A reading greater than 50 indicates that manufacturing is expanding, and less than that indicates contracting.
The Federal Reserve’s industrial production index rose to 104.1 in March, up from 103.5 in February and 102.5 in March 2016. The base is 100 representing output in the year 2012.
The Department of Commerce reported that housing starts dropped 6.8% sequentially to a seasonally adjusted annual rate of 1.22 million homes, although the number was up 9.2% from March 2016. The agency also estimated nonresidential construction spending was $701.9 billion on an annualized basis in February, unchanged from January but 1% higher than 2016 levels. The figure lags one month behind other economic indicators.
Retail sales in March dropped 0.2% sequentially but rose 5.2% year-over-year. The inventory-to-sales ratio was 1.35 in February, unchanged from January but lower than the 1.41 a year ago. The ratio also lags one month behind other indicators.
“While I’m not expecting a surge in truck tonnage anytime soon, the signs remain mostly positive for freight, including lower inventory levels, better manufacturing activity, solid housing starts and good consumer spending,” Costello said. “As a result, we can expect moderate growth going forward.”