


| Rank This Year | Rank Last Year | Company | Revenue (000) | Net Income (000) | Employees | Tractors* | Trailers |
|---|---|---|---|---|---|---|---|
| 1 | 1 | UPS Inc.
|
65,872,000 | 4,910,000 | 454,000 | 18,683 | 97,746 |
| 2 | 2 | FedEx Corp.
|
63,864,000 | 4,465,000 | 425,000 | 29,873 | 113,218 |
| 3 | 3 | XPO
|
15,380,800 | 312,400 | 95,000 | 16,287 | 27,591 |
| 4 | 4 | J.B. Hunt Transport Services
|
7,189,568 | 385,308 | 27,670 | 14,392 | 32,931 |
| 5 | 30 | Knight-Swift Transportation Holdings
|
5,136,261 | 529,922 | 25,400 | 23,069 | 74,949 |
| 6 | 5 | Yellow Corp.
|
4,891,000 | -10,800 | 32,000 | 14,100 | 44,600 |
| 7 | 6 | Schneider
|
4,383,600 | 389,900 | 19,600 | 11,859 | 37,637 |
| 8 | 9 | Hub Group
|
4,034,897 | 135,153 | 4,377 | 3,520 | 5,850 |
| 9 | 10 | TFI International
|
3,906,575 | 130,181 | 17,044 | 16,132 | 24,617 |
| 10 | 9 | Landstar System
|
3,646,364 | 177,088 | 1,273 | 9,438 | 15,534 |
| 11 | 11 | Old Dominion Freight Line
|
3,358,112 | 463,774 | 20,944 | 8,316 | 32,890 |
| 12 | 13 | Ryder Supply Chain Solutions
|
3,065,500 | 158,400 | |||
| 13 | 12 | ArcBest
|
2,826,457 | 59,726 | 13,000 | 4,436 | 22,275 |
| 14 | 14 | Estes Express Lines
|
2,740,000 | - | 17,397 | 6,695 | 27,443 |
| 15 | 16 | Werner Enterprises
|
2,116,737 | 92,000 | 12,154 | 7,480 | 24,500 |
| 16 | 15 | Roadrunner Freight
|
2,091,300 | -91,200 | 4,600 | 3,625 | 6,920 |
| 17 | 27 | NFI
|
1,910,000 | - | 10,000 | 4,000 | 8,900 |
| 18 | 18 | Prime Inc.
|
1,875,031 | 208,184 | 4,300 | 6,296 | 12,753 |
| 19 | 21 | Penske Logistics
|
1,700,000 | - | 18,011 | 2,935 | 9,108 |
| 19 | 17 | UniGroup
|
1,700,000 | - | |||
| 21 | 21 | U.S. Xpress Enterprises
|
1,600,000 | - | 9,522 | 6,600 | 16,800 |
| 22 | 24 | R+L Carriers
|
1,580,000 | - | 5,084 | 15,675 | |
| 23 | 19 | CRST The Transportation Solution
|
1,555,000 | - | 7,538 | 5,774 | 12,145 |
| 24 | 25 | Kenan Advantage Group
|
1,441,440 | - | 9,000 | 6,686 | 10,744 |
| 25 | 26 | C.R. England
|
1,405,411 | - | 7,975 | 4,213 | 6,116 |
| 26 | 21 | Sirva Inc.
|
1,400,000 | - | |||
| 27 | 28 | Saia Inc.
|
1,378,510 | 91,156 | 9,800 | 4,259 | 13,901 |
| 28 | 20 | Purolator
|
1,343,111 | - | 10,000 | 465 | 1,329 |
| 29 | 42 | Daseke Inc.
|
1,300,000 | 26,996 | 4,700 | 5,200 | 11,500 |
| 30 | 29 | Southeastern Freight Lines
|
1,260,050 | - | 8,792 | 3,635 | 11,697 |
| 31 | 32 | Universal Logistics Holdings
|
1,216,665 | 28,153 | 8,231 | 3,784 | 5,765 |
| 32 | 31 | Averitt Express
|
1,146,970 | 98,967 | 8,500 | 4,513 | 14,585 |
| 33 | 37 | Forward Air
|
1,100,816 | 87,321 | 4,898 | 964 | 6,464 |
| 34 | 35 | Crete Carrier Corp.
|
1,100,000 | - | 6,000 | 5,400 | 14,000 |
| 35 | 33 | Celadon Group Inc.
|
1,065,356 | - | 5,200 | 3,850 | 10,000 |
| 36 | 34 | Anderson Trucking Service
|
1,004,301 | - | 1,996 | 2,652 | 6,958 |
| 37 | 38 | KLLM Transport Services
|
959,000 | - | 3,800 | 5,700 | |
| 38 | 39 | Lynden
|
950,000 | - | 2,600 | 768 | 2,889 |
| 39 | 59 | Evans Delivery
|
898,000 | - | 376 | 5,014 | 550 |
| 40 | 41 | Atlas World Group
|
842,100 | 4,800 | 671 | 1,271 | 4,076 |
| 41 | 40 | Ruan
|
836,298 | - | 5,500 | 2,900 | 8,710 |
| 42 | 43 | Quality Carriers
|
786,000 | - | 2,541 | 5,204 | |
| 43 | 44 | Central Transport International
|
754,000 | - | 3,180 | 6,543 | |
| 44 | 36 | Cardinal Logistics
|
720,000 | - | 4,245 | 2,905 | 7,940 |
| 45 | 51 | Day & Ross
|
718,941 | - | 2,240 | 1,800 | 5,714 |
| 46 | 50 | Pitt Ohio Transportation Group
|
715,827 | - | 5,381 | 1,856 | 5,372 |
| 47 | 47 | Covenant Logistics Group
|
705,007 | 55,439 | 4,297 | 2,700 | 7,389 |
| 48 | 46 | Marten Transport
|
698,120 | 90,284 | 3,492 | 2,738 | 4,909 |
| 49 | 49 | Stevens Transport
|
694,980 | 83,845 | 2,925 | 2,810 | 4,010 |
| 50 | 53 | AAA Cooper Transportation
|
665,000 | - | 5,000 | 3,000 | 6,500 |
| 51 | 56 | United Road Services
|
645,000 | - | 1,700 | 1,850 | 1,150 |
| 52 | 58 | Mullen Group
|
627,372 | - | 3,535 | 1,919 | 5,065 |
| 53 | 52 | Heartland Express
|
607,336 | 75,173 | 3,800 | 6,719 | 19,975 |
| 54 | 48 | Jack Cooper Holdings
|
602,825 | 74,839 | 3,753 | 2,637 | |
| 55 | 61 | PS Logistics
|
595,780 | - | 3,000 | 2,500 | |
| 56 | 45 | Trimac Transportation
|
576,796 | - | 3,200 | 1,720 | 3,800 |
| 57 | 56 | OnTrac Inc.
|
572,856 | - | 36 | 950 | |
| 58 | 55 | Western Express
|
566,230 | 41,998 | 2,850 | 2,555 | 7,800 |
| 59 | 60 | Dayton Freight Lines
|
562,000 | - | 4,501 | 1,561 | 3,803 |
| 60 | 54 | Suddath
|
550,000 | - | |||
| 61 | 62 | Canada Cartage System
|
546,309 | - | 3,137 | 2,548 | 2,817 |
| 62 | 69 | Bennett International Group
|
512,874 | - | 1,023 | 1,345 | 2,126 |
| 63 | 63 | Mercer Transportation Co.
|
492,509 | - | 293 | 2,299 | 2,299 |
| 64 | Two Men and a Truck Movers
|
487,236 | - | 6,136 | |||
| 65 | 74 | Bison Transport
|
472,004 | - | 2,944 | 1,704 | 4,732 |
| 66 | 67 | Cowan Systems
|
462,544 | - | 1,946 | 2,122 | 5,677 |
| 67 | 10 Roads Express
|
452,429 | - | 1,935 | 2,421 | ||
| 68 | 64 | Dart Transit Co.
|
451,925 | - | 2,626 | 2,131 | 7,159 |
| 69 | 70 | USA Truck (DB Schenker)
|
446,533 | 7,497 | 2,400 | 1,669 | 5,596 |
| 70 | 66 | Shevell Group
|
439,500 | - | 3,745 | 1,550 | 3,950 |
| 71 | 68 | P.A.M. Transport
|
437,838 | 38,899 | 2,409 | 2,281 | 5,795 |
| 72 | 72 | Mesilla Valley Transportation
|
430,261 | - | 1,760 | 1,450 | 6,000 |
| 73 | 71 | TransX Group of Companies
|
415,541 | - | 2,617 | 1,365 | 4,410 |
| 74 | 73 | TMC Transportation
|
413,000 | - | 2,613 | 3,404 | |
| 75 | 79 | Black Horse Carriers
|
412,500 | - | 3,150 | 1,670 | 3,500 |
| 76 | 81 | Epes Carriers Inc.
|
400,977 | 26,309 | 1,272 | 6,065 | |
| 77 | LaserShip Inc./OnTrac Inc.
|
400,000 | - | 29 | 27 | ||
| 78 | 76 | Roehl Transport
|
384,473 | - | 2,336 | 1,983 | 4,873 |
| 79 | 78 | A. Duie Pyle Inc.
|
373,000 | - | 2,697 | 946 | 1,936 |
| 80 | 80 | Maverick USA
|
352,068 | - | 2,122 | 1,648 | 2,480 |
| 81 | 87 | Transport Investments
|
339,920 | - | 190 | 1,037 | 1,846 |
| 82 | 84 | IMC Cos.
|
332,490 | - | 2,300 | 1,658 | 148 |
| 83 | 82 | Dicom Transportation Group
|
320,700 | - | |||
| 84 | 94 | Salmon Cos.
|
314,303 | - | 713 | 1,092 | |
| 85 | 83 | Cassens Transport Co.
|
302,004 | - | 1,265 | 1,231 | 1,231 |
| 86 | 88 | TransAm Trucking
|
280,000 | - | 1,135 | 1,823 | |
| 87 | 92 | Hirschbach Motor Lines
|
278,494 | - | 800 | 1,250 | 1,965 |
| 88 | 91 | Foodliner/Quest Liner
|
277,471 | - | 1,190 | 1,183 | 2,233 |
| 89 | 85 | Koch Cos.
|
277,000 | - | 1,190 | 1,053 | 5,476 |
| 90 | 86 | Dependable Supply Chain Services
|
274,000 | - | 344 | 1,220 | |
| 91 | 90 | Trans-System Inc.
|
271,000 | - | 1,050 | 1,000 | 1,700 |
| 92 | Melton Truck Lines
|
269,785 | - | 1,569 | 1,310 | 2,111 | |
| 93 | 77 | Central Freight Lines
|
266,000 | - | 2,001 | 8,012 | |
| 94 | 97 | Martin Transportation Systems
|
261,403 | - | 1,725 | 1,060 | 2,250 |
| 95 | 100 | Quantix Supply Chain Solutions
|
259,370 | - | 1,100 | 858 | 1,132 |
| 96 | 89 | Challenger Motor Freight
|
258,734 | - | 1,850 | 1,469 | 3,300 |
| 97 | 93 | United Vision Logistics
|
256,000 | - | 1,003 | 1,347 | |
| 98 | 99 | Superior Bulk Logistics
|
252,300 | 14,500 | 1,370 | 1,100 | 2,000 |
| 99 | 96 | John Christner Trucking
|
244,696 | 13,138 | 222 | 809 | 1,112 |
| 100 | Acme Truck Line
|
239,000 | - | 1,900 | 1,315 | 1,314 |
Top For-Hire Carriers on this list are common and contract freight carriers operating in the United States, Canada and Mexico. Companies are ranked on the basis of annual revenue. To be included in the Top 100 or any of the sectors, please send contact information to tteditor@ttnews.com. We will contact you via phone or e-mail to get information about your company prior to publication of the next Top 100 list.
* Tractor count includes company-owned, lease-to-own and owner-operator tractors.
On the Bubble

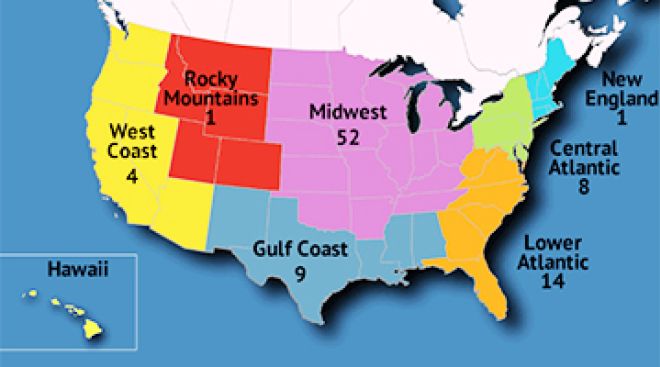
Interactive Map: Where the 2023 Top 100 For-Hire Carriers Are in North America
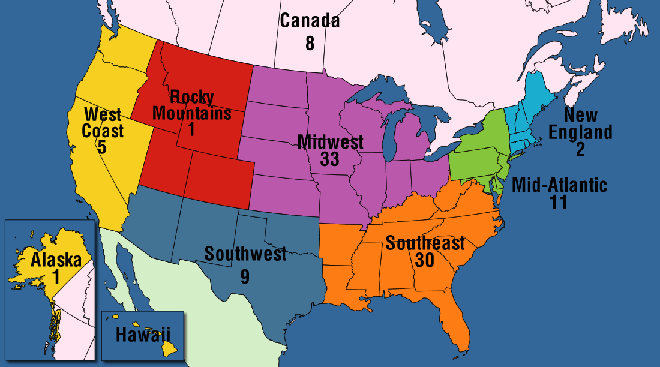
Find out where the 2023 Top 100 For-Hire Carriers are located by regions and by state in North America with our interactive map.
June 23, 2022FedEx Takes Delivery of 150 BrightDrop EVs
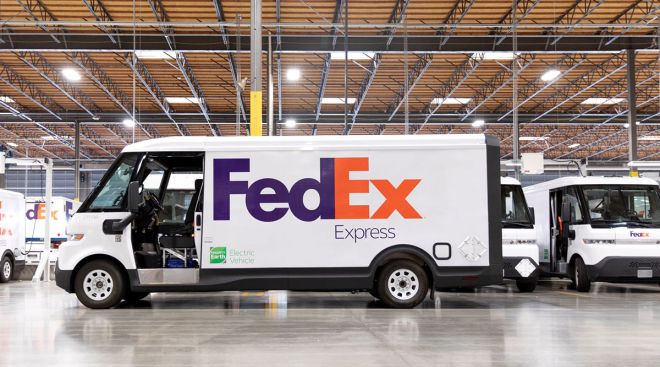
FedEx Corp. announced June 21 it received its first 150 electric delivery vehicles from BrightDrop, the technology startup from General Motors that is decarbonizing last-mile delivery.
June 21, 2022How the Pandemic Accelerated Change for Motor Carriers

Few industries came under as much pressure and made as many adjustments during the COVID-19 pandemic as trucking. Industry executives see permanent changes resulting from how COVID altered the economy, consumer behavior and business interactions.
2022 Top 100 For-Hire Carriers List Illustrates Growth of Large Fleets
Despite lingering supply chain disruptions and an extremely tight labor market, most of the largest for-hire motor carriers in North America achieved significant revenue gains and higher profits last year. That extraordinary business growth is clearly reflected on the 2022 edition of Transport Topics’ Top 100 For-Hire Carriers list.
Ryder Expands Freight Brokerage Business
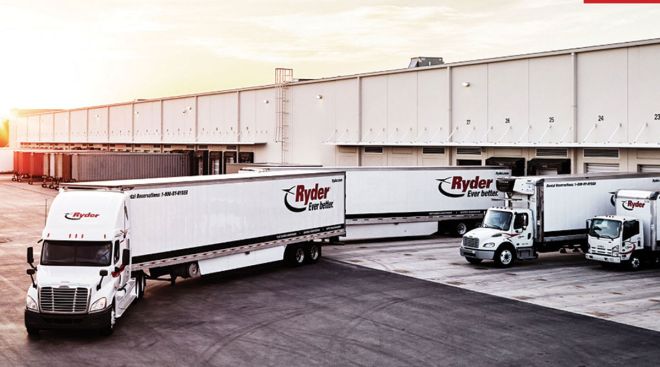
Ryder System Inc. is expanding its freight brokerage business with the addition of new offices, the company announced June 16.
June 17, 2022Firms Leverage Innovations to Manage Supply Chain Disruptions
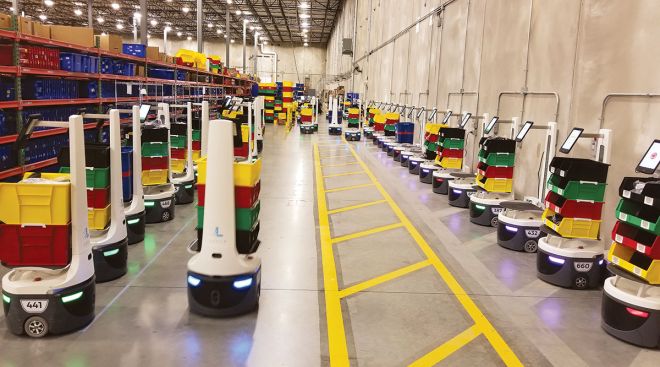
CHICAGO — Trucking and logistics leaders said their companies’ investments in technology and more flexible service offerings have paid dividends during the supply chain turbulence of the past few years.
FedEx Boosts Dividend, Shakes Up Board

FedEx Corp. boosted its dividend and announced board changes in coordination with activist investor D.E. Shaw & Co., shaking up the courier just two weeks into the tenure of new CEO Raj Subramaniam.
Schneider Acquires deBoer Transportation
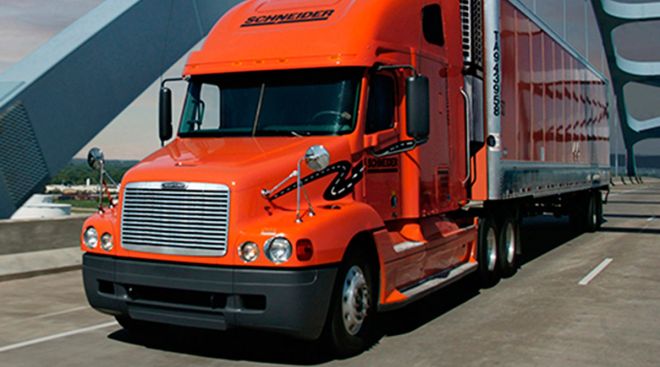
Schneider National announced June 7 that it has closed an acquisition on fellow Wisconsin-based carrier deBoer Transportation, a regional and dedicated carrier headquartered in Blenker.
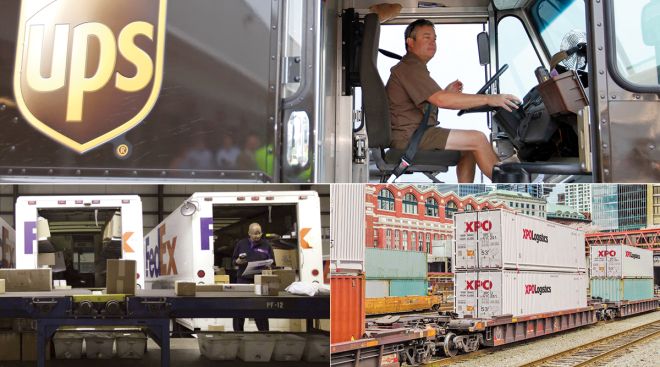
June 8, 2022XPO, Google Cloud Collaborate to Improve Supply Chains

XPO Logistics Inc. and Google Cloud joined forces on a multiyear collaboration to improve supply chains, the companies announced June 6.
June 7, 2022XPO’s SEC Filing Advances Spinoff of Brokerage Platform
XPO Logistics Inc. has filed a confidential Form 10 registration statement with the U.S. Securities and Exchange Commission for the planned spinoff of its tech-enabled brokered transportation platform, the company announced.
June 6, 2022-

2022
-
2021
-
2020
-
2019
-
2018
-
2017
-
2016
-
2015
-
2014
-
2013
-
2012
-
2011
-
2010
-
2009
-
2008
-
2007
-
2006
-
2005
-
2004


