


Truck Turn Times Fall in January Versus 2016 Levels at SoCal Ports
The average time it took a truck driver to enter and exit the two largest ports in North America increased by five minutes in January to 81 minutes, sequentially, according to monthly data from the Harbor Trucking Association of California.
However, the turn time was better than the 91-minute average at the Los Angeles and Long Beach, California, ports during the same month in 2016.
The 81-minutes turn time also marked the quickest January since 2014.
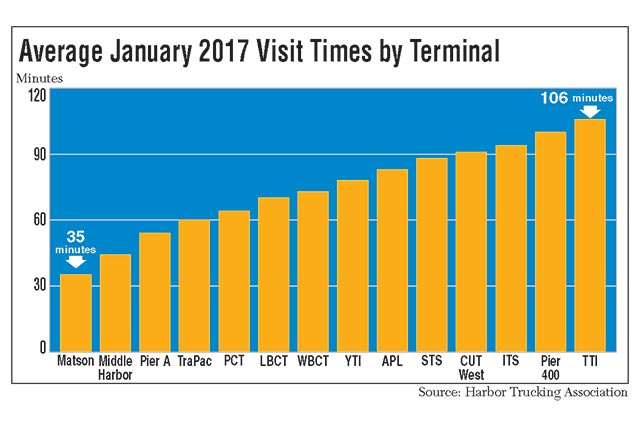
The slowest terminal at the Port of Los Angeles was Pier 400 at 100 minutes; at the Long Beach port, Total Terminals International was slowest at 106 minutes. On average, truck drivers had to wait in line 46 minutes outside Total Terminals and 77 minutes inside.
The Port of Los Angeles is the largest in North America, followed by neighboring Long Beach.
“The terminals at Pier 400-APMT and at TTI are the largest, so you will see longer turn times, in general. Nevertheless, the results were better than a year ago,” said Weston LaBar, executive director of the Harbor Trucking Association.
He added, “I think the ports should be commended for creating efficiency groups and having ongoing stakeholder dialogue. Some of these hurdles that cause delays, while not solved, have been mitigated.”
The quickest terminal in Los Angeles was the semi-automated TraPac facility at 60 minutes, and in Long Beach, it was Matson at 35 minutes. Matson is the smallest terminal in terms of container volume. Middle Harbor, the fully automated terminal at Pier E, was the second-quickest at 44 minutes. On average, truck drivers waited eight minutes to enter Matson and 12 minutes at Middle Harbor and spent 18 minutes and 29 minutes, respectively, inside the terminals.
The quicker turn time in January was notable because it was accomplished despite higher container traffic year-over-year. Industry analysts expected a January surge in container traffic in the run-up to the Chinese Lunar New Year on Jan. 28, when factories shut down for up to two weeks.
Retailers also replenish their inventories in January — after the holiday season.
In January, the Port of Los Angeles handled 826,640 industry standard 20-foot-equivalent units, or TEUs, a 17% gain over the same period last year. That marked the busiest January in the port’s 110-year history, port officials said, noting that January 2016 was the previous record for the first month of the year.
“Coming off our best year ever in 2016, it’s very encouraging to keep the momentum going into 2017,” said Gene Seroka, executive director of the Port of Los Angeles.
January 2017 loaded container imports increased 13.1% to 415,423 TEUs, and exports surged 28.7% to 162,420. Total loaded imports of 577,843 TEUs increased 17.1% compared with the previous year.
The Port of Long Beach also started 2017 on a positive note, handling 582,689 TEUs in January, an 8.7% increase from a year ago. Loaded import containers rose 7.4% to 298,990, and exports surged 11% to 118,234. Port officials said the outcome was notable because traffic in January 2016 jumped 25% from the same month in 2015.
“It was a tough benchmark, so we’re very happy with the way the new year is starting in Long Beach,” said Lori Ann Guzmán, president of the Board of Harbor Commissioners.
Meanwhile, the Port of Virginia, which ranks No. 7 in North America, moved 228,516 TEUs in January, a new monthly record and 19% higher compared with last January. Imported containers, either empty or loaded, increased 20% to 107,284, and exports were up 18% to 121,232.
“We have had 12 consecutive months of volume exceeding 210,000 TEUs, so we are seeing consistency and it is our belief that there will be additional growth in the coming months,” said John Reinhart, CEO of the Virginia Port Authority. He noted the expansion at the Virginia International Gateway terminal. “The volumes we are seeing are a clear indicator that we are adding capacity at the right time.”
The Port of Oakland, No. 9, handled 197,312 TEUs in January, up 3.2%. Loaded imported containers rose 3.6% to 80,443 and exports surged 9% to 73,352.
“We’ve been cautiously optimistic about 2017 cargo volumes, and this is a solid start to the year,” said John Driscoll, maritime director of the Port of Oakland.
The South Carolina Ports Authority announced a January record of 185,018 TEUs, surging 28% year-over-year.
Meanwhile, the National Retail Federation predicts imports will jump 4.6% during the first half of 2017 versus 2016, according to the monthly Global Port Tracker report compiled by Hackett Associates.
“This is very much in line with what we are forecasting for retail sales and consumer spending this year,” said Jonathan Gold, NRF vice president for supply chain and customs policy. “Retailers try to balance inventories very carefully with demand. So when retailers import more merchandise, that’s a pretty good indicator of what they are expecting to happen with sales.”