Spot Market on Fire Starting 2018, Data Shows

The spot market begins 2018 red hot with some of the highest linehaul rates on record closing out December while load-to-truck ratios matched levels only seen in 2014.
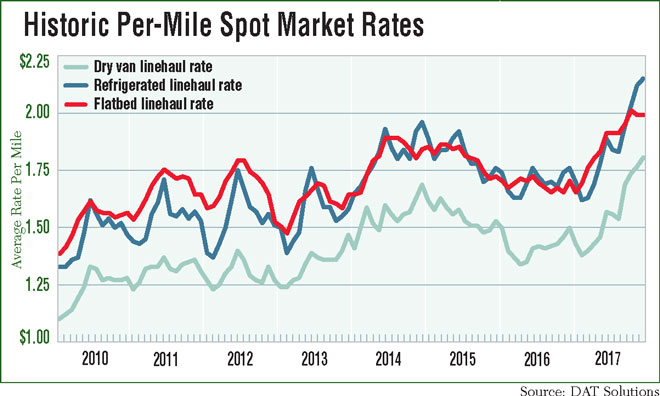
Nationwide dry van rates ended last month at $1.81 per mile, flatbed was $2 and reefer was $2.15, according to data from load board operator DAT Solutions. The dry van and reefer rates were the highest in any month since at least DAT began tracking the metric in 2010. The flatbed number is second only to the $2.02 per mile in October.
At the end of 2016, dry van rates were $1.50 per mile, flatbed was $1.71 and reefer was $1.76.
Mark Montague, DAT senior industry analyst, said that one reason the rates were so high was freight volumes. In 2016, Atlanta was the only market with more than 1 million van load posts on the DAT load board. In 2017, there were 14 markets with more than 1 million van load posts and Atlanta was the first market to crack the 2 million mark.
“There are hurricane effects that are still ongoing, but e-commerce has been a strong driver of the surge in spot market volumes,” Montague said. “It used to be that April was the peak of the spot market, but now it’s December with the holiday season.”
The KeyBanc Capital Markets Inc. Truckload Spot Rate Index showed similar results to the DAT findings. The dry-van spot rate excluding fuel index increased 19% year-over-year in the fourth quarter and 12% for the full year. Refrigerated rates were up 20% in the fourth quarter and 12% for the entire year. Flatbed rates rose 23% in the fourth quarter and 14% in 2017. All amounts exclude the impact of fuel on rates and are based on information from Internet Truckstop.
Recent checks suggest freight activity remained favorable during the fourth quarter, with about 66% of contacts indicating “demand was ‘better than expected,’ over 85% experiencing a stronger holiday peak relative to last year, and 100% indicating capacity was ‘tight’ to ‘very tight,’ ” KeyBank analyst Todd Fowler wrote in a note to investors.
Load-to-truck ratios also remain elevated and tipped far more towards the truck driver than a year ago. For dry van, the DAT average was nine loads posted for every truck available. For reefer, it was 14.1. Flatbed was 35.6. DAT’s dry van ratio was the highest ever, although in flatbed and reefer the numbers were slightly short of the peak capacity crunch during the robust spot market in 2014.
At the end of 2016, the ratio for dry van was 3.8, reefer was 8.2 and flatbed was 20.2.
It remains to be seen whether the spot market is strong enough that it’ll motivate some drivers on the fence about exiting the industry because of the electronic logging mandate to stay in the trucking industry to ride the wave to the crest.
The spot market strength will also trickle into the contract market with negotiations on annual contracts look much more favorable to the trucking community than the last two bid cycles.
A KeyBank survey of shippers and carriers pegged the weighted average contract renewal rate to increase between 5.8% and 6.2% compared with last year.
DAT also released its top 10 markets in the dry van, flatbed and refrigerated spot markets, based on the origin of the load.
Atlanta was the top market in the dry van and refrigerated sectors. In flatbed, the top spot went to Little Rock, Ark.
Despite Hurricane Harvey, Houston took the No. 2 location in dry van, No. 8 in refrigerated and No. 5 on flatbed. Dallas was No. 4 on the dry van and No. 3 on the refrigerated lists.
“Houston was having an excellent year before Harvey hit the city. But remember, the Port of Houston recovered and reopened about a week after the hurricane,” Montague said. “It’s not just moving machinery from Texas, but also finished goods such as industrial plastics and resins, which support a variety of industries,” Montague said.
Chicago was No. 5 in dry van and No. 4 in refrigerated.
On the flatbed list, four of the top 10 were in Alabama and one both in Mississippi and Louisiana.
Rankings are based on the DAT database of more than 170 million loads and trucks posted annually.