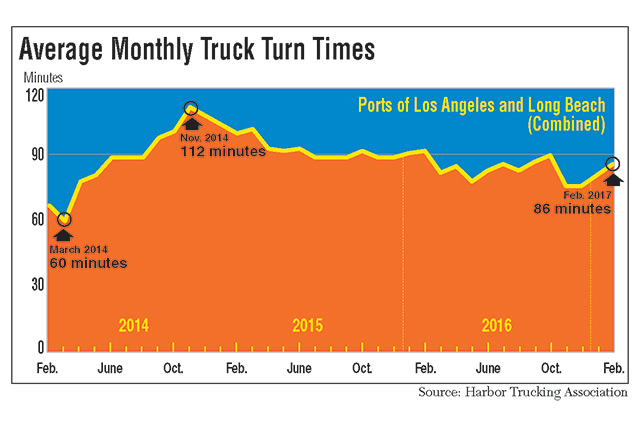
Feb. Turn Times Rise at SoCal Ports Despite a Drop in Container Traffic

This story appears in the March 20 print edition of Transport Topics.
The total time it took a truck to enter and exit the two largest ports in North America rose a few minutes in February on a sequential basis, despite a double- digit percentage drop in container traffic in Los Angeles and Long Beach, California, due to the earlier Chinese New Year.
Factories ramp up production in the weeks leading up to the Chinese New Year, but then shut down for one or more weeks to celebrate the lunar holiday. The Chinese New Year began Jan. 28 this year, compared with Feb. 8, 2016, and Feb. 19, 2015.
Nevertheless, the turn time for a truck entering the ports in Los Angeles and Long Beach — Nos. 1 and 2 respectively — increased to 86 minutes from 81 minutes in January, despite container traffic dropping at both ports sequentially and year-over-year. However, the turn time was better than the 92 minutes in February 2016, according to the monthly data from the Harbor Trucking Association.
In Los Angeles, Pier 400 was the slowest terminal for the second consecutive month at 107 minutes. Notably, turn times at the semi-automated TraPac terminal significantly rose from 60 to 102 minutes month-over-month, although HTA Executive Director Weston LaBar was unsure about the cause. In Long Beach, International Transportation Service, or ITS, was the slowest terminal at 99 minutes.
The Matson and Middle Harbor terminals remained the quickest at 41 and 48 minutes, respectively. In Los Angeles, the West Basin Container Terminal, or WBCT, was the quickest at 65 minutes.
Due to the Chinese New Year, container traffic at the Port of Los Angeles fell 12% to 625,381 industry-standard 20-foot equivalent units, or TEUs, compared with the February record of 713,721 set last year. Imports dropped 20% to 298,974 TEUs, but exports increased 6.1% to 155,357. However, port officials pointed out that compared with the five-year average for the month, February 2017 volumes were up 7.2%. For the first two months of 2017, volumes have increased 2.3% compared with the same period last year.
In Long Beach, container traffic dropped 11% to 498,311 TEUs on a year-over-year basis, but February 2016 set a record of 561,412. Import containers were down 16% in February to 249,759, while exports were off 2.6% to 119,811. Container traffic through the first two months was down 1.5% compared with 2016.
The two ports also worked with the trucking industry ahead of a March 3 vote on the Air Quality Management Plan. A Southern California air pollution control agency rejected an amendment that would have given the board control to issue emissions rules to the ports and drayage truckers. But an advisory group will be formed to work with the ports, terminals and trucking community to find common ground.
“We weren’t exactly happy with the outcome. It wasn’t a win. One of the big concerns for us is an expedited path to zero- and near-zero emissions vehicles,.” LaBar said. “They’re basically telling us we have to get there but giving us no clear path. [The Air Quality Management District board] is trying to regulate something that they don’t have the regulatory oversight to do, which really concerns our members.”
Meanwhile, PierPass released an audit March 13 about the fees charged to cargo owners to have truck drivers pick up containers during the day. The organization assesses a $69.17 per-TEU traffic mitigation fee to encourage evening pickups and then distributes the money to terminal operators to fund a second shift. Auditor KPMG estimated that it actually costs $108 per TEU to operate the longer hours, 56% higher than the fee.
“From the trucker’s perspective, we find the fee to be very onerous. We also think the audit has a few holes in it,” LaBar said.
HTA, the California Trucking Association and the National Retail Federation will write a joint letter to express their concerns and push for a technological solution to reduce turn times and lower costs.
In Northern California, Chinese New Year resulted in a 7% decline in traffic at the Port of Oakland to 174,906 TEUs. Export volume — about half of all traffic — declined 1.2% versus February 2016. It was only the second decrease in exports since the beginning of 2015. The port ranks No. 9 in container volume in North America.
The Port of Virginia, ranked No. 7, reported container traffic dropped less than 0.2% to 220,376 TEUs compared with the prior year. Imported full containers dropped 3% to 96,921, but exports rose 4.6% to 85,827.
“February 2016 was 29 days long versus 28 [this year], so our cargo flows remain consistent with a good balance in our export-import trade,” Virginia Port Authority CEO John Reinhart said.
The Port of Charleston, No. 11, handled 175,820 TEUs in February, 11% higher than a year ago. Loaded imports rose 6.3% to 73,855, and exports increased 3.7% to 66,296. Through the first two months, total container traffic is up 19% to 360,837 versus 2016.
“Last month’s volumes reflect strong growth over last year, and we handled the highest pier container volume ever during a February,” South Carolina Ports Authority CEO Jim Newsome said. “Looking ahead, spring is traditionally a busy season for us, but volumes may be inconsistent due to the implementation of new shipping alliances.”
SCPA also broke ground in March on an inland port in Dillon, which is slated to open next year. Similar to an inland port in Greer, it will connect to Charleston via rail and give trucks alternative locations to pick up containers.

