


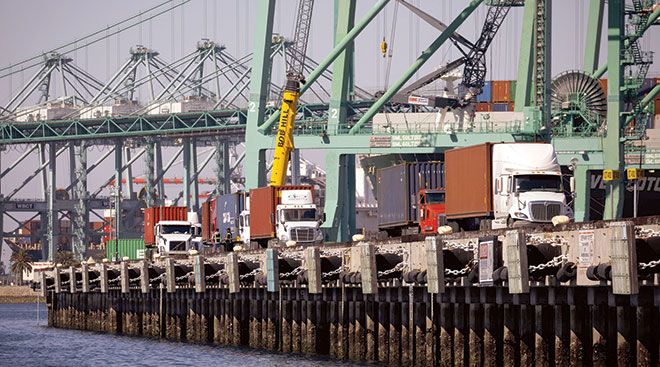
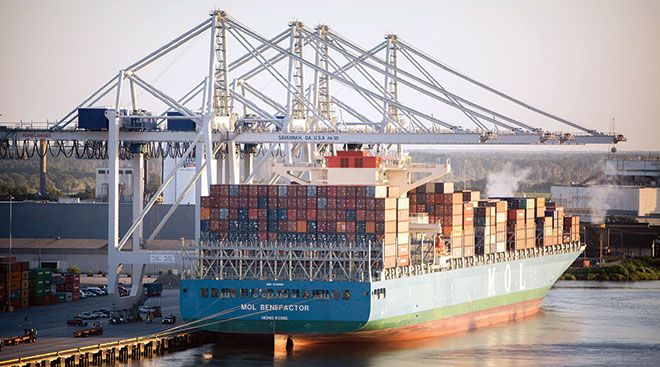
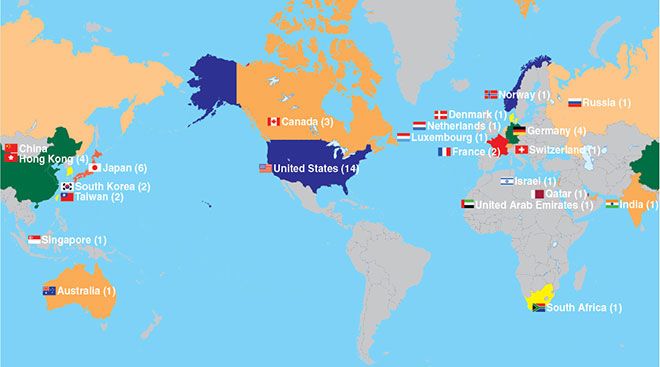
Top 50 Global Freight | Airport Data
Port Data: Pacific Northwest | California & Pacific Islands | North Atlantic | Mid-Atlantic & South Atlantic | Mexico & Central America | Gulf Coast | Caribbean | Great Lakes
| Rank This Year | Rank Last Year | Company | Headquarters | Freight Revenue (Millions) | Total Revenue (Millions) | Freight Revenue Share |
|---|---|---|---|---|---|---|
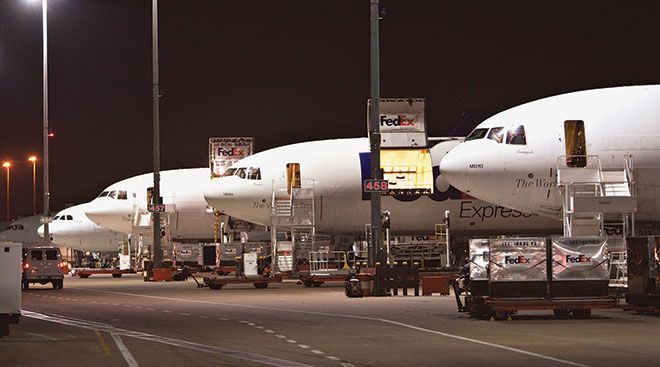
| 1 | 1 | FedEx Corp. | USA | $64,690 | $69,189 | 93.5% |
| 2 | 2 | UPS Inc. | USA | $63,978 | $74,094 | 86.3% |
| 3 | 3 | China Railway Corp. | China | $44,468 | $163,536 | 27.2% |
| 4 | 4 | Maersk | Denmark | $34,839 | $38,890 | 89.6% |
| 5 | 7 | CMA CGM Group | France | $30,254 | $30,254 | 100.0% |
| 6 | 5 | Russian Railways | Russia | $26,267 | $38,618 | 68.0% |
| 7 | 6 | Deutsche Post DHL Group | Germany | $24,265 | $70,940 | 34.2% |
| 8 | 8 | Mediterranean Shipping Co. | Switzerland | $24,002 | $24,002 | 100.0% |
| 9 | 10 | BNSF Railway | USA | $22,328 | $23,515 | 95.0% |
| 10 | 12 | COSCO Shipping Group | China | $21,787 | $21,787 | 100.0% |
| 11 | 9 | Union Pacific Corp. | USA | $21,708 | $21,708 | 100.0% |
| 12 | 11 | Indian Railways | India | $19,036 | $26,991 | 70.5% |
| 13 | 15 | SF Express | China | $16,050 | $16,050 | 100.0% |
| 14 | 14 | Hapag-Lloyd AG | Germany | $14,121 | $14,121 | 100.0% |
| 15 | 13 | Deutsche Bahn AG | Germany | $12,963 | $49,761 | 26.0% |
| 16 | 16 | Yamato Holdings | Japan | $12,517 | $14,911 | 83.9% |
| 17 | 17 | CSX Corp. | USA | $11,937 | $11,937 | 100.0% |
| 18 | 19 | Norfolk Southern Corp. | USA | $11,296 | $11,296 | 100.0% |
| 19 | 20 | Canadian National Railway | Canada | $10,953 | $11,241 | 97.4% |
| 20 | 18 | NYK Group | Japan | $10,210 | $16,262 | 62.8% |
| 21 | 21 | Mitsui O.S.K Lines | Japan | $9,696 | $10,633 | 91.2% |
| 22 | 22 | SG Holdings | Japan | $9,036 | $10,683 | 84.6% |
| 23 | 23 | GeoPost Group | France | $8,600 | $8,600 | 100.0% |
| 24 | 25 | XPO | USA | $7,864 | $16,648 | 47.2% |
| 25 | 26 | J.B. Hunt Transport Services | USA | $7,829 | $9,165 | 85.4% |
| 26 | 24 | Kawasaki Kisen Kaisha Ltd. (K Line) | Japan | $7,022 | $7,022 | 100.0% |
| 27 | 27 | Canadian Pacific Railway | Canada | $5,737 | $5,872 | 97.7% |
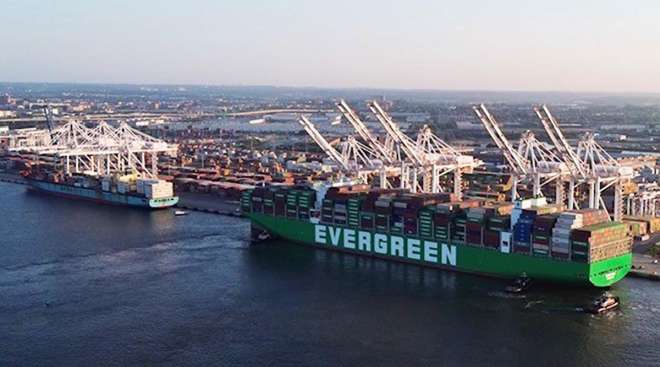
| 28 | 28 | Evergreen Marine Corp. | Taiwan | $5,682 | $6,168 | 92.1% |
| 29 | 29 | Yellow Corp. | USA | $4,871 | $4,871 | 100.0% |
| 30 | 32 | Yang Ming Marine Transport Corp. | Taiwan | $4,828 | $4,828 | 100.0% |
| 31 | 31 | Hyundai Merchant Marine Co. | South Korea | $4,729 | $4,729 | 100.0% |
| 32 | 30 | Knight-Swift Transportation | USA | $4,408 | $4,844 | 91.0% |
| 33 | 35 | Old Dominion Freight Line | USA | $4,109 | $4,109 | 100.0% |
| 34 | 33 | Transnet Group | South Africa | $4,083 | $5,276 | 77.4% |
| 35 | 36 | General Logistics Systems | Netherlands | $4,034 | $4,034 | 100.0% |
| 36 | 34 | Schneider | USA | $3,864 | $4,747 | 81.4% |
| 37 | 37 | TFI International | Canada | $3,691 | $3,902 | 94.6% |
| 38 | 40 | Nippon Express | Japan | $3,604 | $19,305 | 18.7% |
| 39 | 41 | ZIM Integrated Shipping Services | Israel | $3,300 | $3,300 | 100.0% |
| 40 | 39 | Emirates Group | UAE | $3,051 | $24,774 | 12.3% |
| 41 | 38 | Cathay Pacific Airways | Hong Kong | $3,039 | $13,653 | 22.3% |
| 42 | 44 | Wallenius Wilhelmsen Group | Norway | $2,998 | $3,909 | 76.7% |
| 43 | 49 | Kansas City Southern | USA | $2,886 | $2,886 | 100.0% |
| 44 | 43 | Toll Group | Australia | $2,870 | $5,827 | 49.3% |
| 45 | 46 | Estes Express Lines | USA | $2,818 | $3,254 | 86.6% |
| 46 | - | Ukrainian Railways | Ukraine | $2,809 | $3,502 | 80.2% |
| 47 | 42 | Lufthansa Group | Germany | $2,775 | $41,061 | 6.8% |
| 48 | 47 | Qatar Airways | Qatar | $2,725 | $14,033 | 19.4% |
| 49 | 45 | Pacific International Lines | Singapore | $2,639 | $3,831 | 68.9% |
| 50 | - | Kazakhstan Temir Zholy | Kazakhstan | $2,499 | $2,974 | 84.0% |
Top 50 Global Freight Companies
Revenue from acquired companies only included for period after close of acquisition. All revenue figures have been converted to U.S. dollars based on the average exchange rate in the appropriate calendar year.
Sources: Company reports and SJ Consulting Group Inc. estimates
To be included in the Top 50 list, please send contact information to tteditor@ttnews.com. We will contact you via phone or e-mail to get information about your company prior to publication of the next Top 50 list.


Amazon Prime Memberships in US Gain 8% to New High

Amazon.com Inc.’s Prime subscription service hit a new high of 180 million U.S. shoppers in March, up 8% from a year earlier, according to Consumer Intelligence Research Partners.
April 16, 2024Amazon Becomes the Largest US Private EV Charging Operator

Amazon has installed more than 17,000 chargers at about 120 warehouses around the U.S., making the retail giant the largest operator of private EV charging infrastructure in the country.
April 15, 2024Shipping Giant MSC Vows to Fight ‘Excessive’ $63M FMC Fine
The world’s largest container carrier will push back against a proposed U.S. government fine that would rank among the stiffest penalties handed down by the Washington regulator.
April 10, 2024Amazon Eyes Record High

Wall Street investors are finally doing what analysts have been recommending all along: buying Amazon.com Inc.
April 8, 2024Baltimore Bridge Collapses After Cargo Ship Rams Into It

BALTIMORE — A containership lost power and rammed into a major bridge in Baltimore early March 26, causing the span to buckle into the river below. Six people were missing.
March 26, 2024Amazon Reports ‘Measurable Progress’ on Worker Safety

Amazon’s safety data shows a decline in its warehouse injury rate in 2023, marking an improvement for the second consecutive year, but critics disagree with how the company measures safety.
March 18, 2024Hapag-Lloyd Warns of Further Earnings Decline in 2024
Following a slump in profits in 2023, German container shipping company Hapag-Lloyd expects earnings to decline again in 2024.
March 14, 2024Houthi Missile Damages MSC Containership in Gulf of Aden
Houthi militants attacked and damaged a Swiss-owned container vessel on March 4 in the Gulf of Aden, as the Iran-backed group continues to roil shipping in the region.
March 5, 2024Norfolk Southern Urges Shareholders to Reject Takeover Plan

OMAHA, Neb. — Norfolk Southern wants its shareholders to back its current management team and strategy and reject a bid from a group of investors seeking to take control of the railroad.
February 27, 2024Port of Baltimore Hit Cargo Record Last Year
The Port of Baltimore hit records for handling cargo last year, state officials said, showing a rebound from global supply chain difficulties and disruptions during the pandemic.
February 26, 2024-

2022
-
2021
-
2020
-
2019
-
2018
-
2017
-
2016
-
2015


