


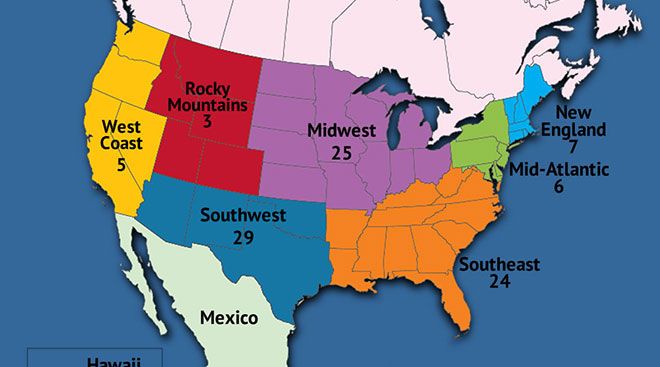
See the headquarters locations for each of the Top 100 private carriers in North America.
Top 100 Private | Food Service | Grocery | Beverage | Petroleum/Chemical | Industrial Gases | Agriculture/Food Processing | Wholesale/Retail | Manufacturing
Equipment Rental | Building Materials | Waste Management | Paper/Office Products | Construction | Health Care | Uniform Rental | Media & Entertainment
| Rank This Year | Rank Last Year | Company | Tractors | Trucks | Pickups/ Cargo Vans | Trailers | Annual Revenue |
|---|---|---|---|---|---|---|---|
| 1 | 1 | PepsiCo Inc. |
10,950 | 4,550 | 16,250 | 17,900 | $67.2 billion |
| 2 | 2 | Sysco Corp. |
8,745 | 1,345 | 840 | 10,593 | $60.1 billion |
| 3 | 4 | Walmart Inc. |
7,400 | 25 | - | 58,826 | $524.0 billion |
| 4 | 6 | Halliburton Co. |
6,101 | 2,471 | 237 | 11,653 | $22.4 billion |
| 5 | 3 | US Foods |
5,821 | 421 | - | 7,466 | $25.9 billion |
| 6 | 5 | Reyes Holdings |
5,019 | 938 | 1,324 | 7,494 | $33.0 billion |
| 7 | 10 | Performance Food Group |
4,715 | 606 | - | 5,999 | $19.7 billion |
| 8 | 8 | McLane Co. |
3,886 | 111 | 25 | 5,853 | $50.4 billion |
| 9 | 9 | Schlumberger Limited |
3,652 | 510 | 249 | 5,107 | $32.9 billion |
| 10 | 13 | NexTier Oilfield Solutions |
2,759 | 493 | 65 | 3,642 | $3.4 billion |
| 11 | 11 | Tyson Foods |
2,642 | 62 | 1,433 | 8,051 | $42.4 billion |
| 12 | 12 | United Rentals Inc. |
2,253 | 4,266 | - | 2,100 | $9.4 billion |
| 13 | 17 | Basic Energy Services |
2,156 | 899 | - | 3,036 | $0.6 billion |
| 14 | 15 | Gordon Food Service |
1,993 | 22 | - | 2,823 | $14.0 billion |
| 15 | 16 | CHS Inc. |
1,656 | 5,382 | - | 9,188 | $31.9 billion |
| 16 | 24 | Sunbelt Rentals |
1,589 | 4,102 | 4,480 | 1,575 | $5.5 billion |
| 17 | 22 | Dot Foods |
1,526 | 10 | 40 | 2,570 | $8.2 billion |
| 18 | 19 | American Air Liquide Holdings |
1,461 | 4,214 | - | 2,352 | $26.3 billion |
| 19 | 20 | Coca-Cola Bottling Co. United |
1,437 | 513 | - | 1,915 | $4.8 billion |
| 20 | 23 | United Natural Foods Inc. (UNFI) |
1,414 | 9 | - | 3,430 | $21.4 billion |
| 21 | 36 | Univar Solutions |
1,372 | 111 | - | 3,489 | $16.8 billion |
| 22 | 25 | The Quikrete Cos. |
1,358 | 45 | - | 2,051 | - |
| 23 | 33 | Pilot Co. |
1,340 | 28 | - | 1,720 | - |
| 24 | 18 | Cudd Energy Services |
1,320 | 240 | - | 1,448 | - |
| 25 | 14 | Helena Agri-Enterprises |
1,237 | 2,838 | - | 2,575 | - |
| 26 | 28 | Linde |
1,215 | 1,568 | - | 2,897 | $11.0 billion |
| 27 | 28 | Cemex USA |
1,190 | 5,967 | - | 1,819 | $6.7 billion |
| 28 | 58 | ProPetro Holding Corp. |
1,156 | 32 | - | 1,662 | $2.1 billion |
| 29 | 35 | Ahold USA/Delhaize America |
1,149 | 625 | - | 4,577 | $48.0 billion |
| 30 | 26 | Clean Harbors |
1,097 | 4,531 | 33 | 3,788 | $3.4 billion |
| 31 | 32 | Ben E. Keith Co. |
1,094 | 73 | - | 1,348 | - |
| 32 | 31 | Core-Mark Holding Co. |
1,079 | 129 | - | 1,216 | $16.7 billion |
| 33 | 34 | FTS International |
1,037 | 80 | - | 1,002 | $0.8 billion |
| 34 | 40 | Builders FirstSource |
1,029 | 2,320 | - | 1,776 | $7.3 billion |
| 35 | 21 | Albertsons Cos. |
1,020 | 1,050 | - | 3,688 | $62.5 billion |
| 36 | 39 | Ashley Furniture Industries |
970 | 10 | 7 | 3,708 | - |
| 37 | 56 | Love's Travel Stops & Country Stores |
963 | - | - | 3,708 | - |
| 38 | 37 | Walgreen Co. |
959 | 23 | - | 2,595 | $136.9 billion |
| 39 | 43 | The Kroger Co. |
942 | 16 | - | 14,085 | $122.3 billion |
| 40 | 41 | CRH Americas (formerly Oldcastle Inc.) |
927 | 1,739 | - | 2,304 | $12.5 billion |
| 41 | 42 | Dean Foods Co. |
865 | 785 | - | 2,552 | $7.3 billion |
| 42 | 38 | Maxim Crane Works |
859 | 624 | - | 1,750 | - |
| 43 | 50 | Sherwin-Williams Co. |
839 | 1 | - | 1,996 | $17.9 billion |
| 44 | 46 | Swire Coca-Cola USA |
838 | 499 | - | 1,181 | $2.2 billion |
| 45 | 45 | BlueLinx Holdings |
836 | 44 | - | 848 | $2.6 billion |
| 46 | 44 | Energy Transfer Partners |
820 | 6 | - | 865 | $54.2 billion |
| 47 | 54 | Mondelez International |
808 | 64 | - | 1,031 | $7.1 billion |
| 48 | 48 | Darling Ingredients |
805 | 884 | 82 | 4,276 | $3.4 billion |
| 49 | 85 | Medline Inc. |
791 | 214 | - | 1,177 | $13.9 billion |
| 50 | 51 | Nestle USA |
790 | 3,475 | 6 | 1,586 | $93.1 billion |
| 51 | 62 | Messer Americas |
787 | 642 | - | 2,268 | $1.7 billion |
| 52 | 54 | ABC Supply Co. |
783 | 2,837 | 0 | 1,020 | $12.0 billion |
| 53 | 58 | Plains All American Pipeline |
760 | - | - | 900 | $33.7 billion |
| 54 | 61 | Brenntag North America |
759 | 462 | - | 1,692 | $5.7 billion |
| 55 | 72 | Shamrock Foods Co. |
741 | 92 | 100 | 1,020 | - |
| 56 | 53 | Calfrac Well Services |
740 | 203 | 19 | 1,077 | $1.2 billion |
| 57 | 63 | JBS USA Holdings |
739 | - | - | 1,336 | - |
| 58 | 57 | Prairie Farms Dairy |
730 | 1,122 | - | 2,277 | - |
| 59 | 64 | Southern Glazer's Wine & Spirits |
721 | 2,189 | - | 820 | - |
| 60 | 68 | Shaw Industries Group |
695 | 55 | - | 3,212 | - |
| 61 | 69 | Anheuser-Busch Cos. |
687 | 261 | - | 754 | $52.3 billion |
| 62 | 66 | Nine Energy Service |
685 | 276 | - | 840 | $832.9 billion |
| 63 | 71 | Coca-Cola Beverages Northeast |
677 | 100 | - | 890 | - |
| 64 | 76 | Publix Super Markets |
668 | 26 | 443 | 3,300 | $38.1 billion |
| 65 | 52 | Veritiv Corp. |
661 | 53 | 130 | 1,026 | $7.7 billion |
| 66 | 73 | Baker Hughes |
642 | 55 | - | 355 | $23.8 billion |
| 67 | 82 | Stericycle Inc. |
627 | 5,871 | - | 2,367 | $3.3 billion |
| 68 | 84 | Mohawk Industries |
624 | 153 | - | 2,565 | $10.0 billion |
| 69 | 70 | Advanced Drainage Systems |
620 | 4 | - | 1,195 | $1.4 billion |
| 70 | 80 | Liberty Coca-Cola Beverages |
611 | 225 | - | 755 | - |
| 71 | 47 | Beacon Roofing Supply |
603 | 1,860 | - | 1,238 | $7.1 billion |
| 72 | 77 | MDU Resources Group |
599 | 1,861 | 5 | 1,841 | $5.4 billion |
| 73 | 75 | Air Products |
598 | 92 | 330 | 2,000 | $8.9 billion |
| 73 | 81 | Coca-Cola Beverages Florida |
598 | 14 | - | 657 | - |
| 75 | 79 | Williams Bros. Construction |
575 | 201 | - | 432 | - |
| 76 | 97 | Herc Rentals |
568 | 345 | - | 666 | $2.0 billion |
| 77 | 86 | H-E-B Grocery Co. |
567 | 8 | - | 3,002 | - |
| 78 | 83 | Ecology Auto Parts |
565 | 13 | - | 679 | - |
| 79 | 74 | SE Independent Delivery Services |
543 | 139 | - | 1,280 | - |
| 80 | 90 | Sanderson Farms |
542 | 27 | - | 644 | $3.4 billion |
| 81 | 66 | Archer Daniels Midland Co. |
535 | - | - | 1,500 | $64.7 billion |
| 82 | 88 | Domino's Pizza |
517 | 39 | - | 506 | $3.6 billion |
| 83 | 94 | Ace Hardware Corp. |
505 | 1 | 1 | 1,666 | $6.1 billion |
| 84 | Stallion Oilfield Services |
502 | 749 | - | 1,614 | - | |
| 85 | 99 | Foster Farms |
501 | 10 | 150 | 1,800 | $2.4 billion |
| 86 | 87 | SpartanNash |
489 | 27 | - | 1,931 | $8.5 billion |
| 87 | Costco Wholsale Corp. |
484 | 308 | - | 4,294 | $149.4 billion |
|
| 88 | 100 | KeHE Distributors |
472 | 1 | - | 793 | $5.0 billion |
| 89 | 78 | Gravity Oilfield Services |
471 | 51 | - | 510 | - |
| 90 | 92 | Valley Proteins |
458 | 130 | 0 | 1,360 | - |
| 91 | 95 | Bragg Cos. |
454 | - | - | 808 | - |
| 92 | 49 | Key Energy Services |
453 | 133 | - | 524 | $0.4 billion |
| 93 | 96 | Columbia Distributing |
452 | - | - | 526 | - |
| 94 | 91 | C&S Wholesale Grocers |
451 | - | - | 4,543 | - |
| 95 | 98 | The H.T. Hackney Co. |
443 | 172 | - | 613 | - |
| 96 | 89 | Bunzl Distribution USA |
442 | 29 | - | 836 | - |
| 97 | 60 | Select Energy Services |
417 | 723 | - | 3,390 | - |
| 98 | Hobby Lobby Stores Inc. |
415 | 5 | - | 1,426 | - | |
| 99 | O'Reilly Auto Enterprises |
413 | 9 | - | 468 | $10.1 billion |
|
| 100 | Dunkin' Brands Group |
397 | 12 | - | 450 | $1.4 billion |
The Top 100 Private Carriers Companies on this list operate their own trucks to carry freight and are ranked on the basis of the total number of highway tractors in the fleet. To be included in the Top 100 list, please send contact information to tteditor@ttnews.com. We will contact you via phone or e-mail to get information about your company prior to publication of the next Top 100 list.
On the Bubble
PepsiCo Beats Q1 Revenue Forecasts
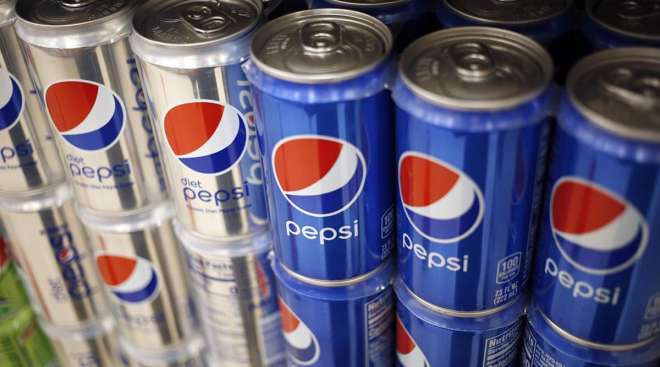
PepsiCo reported better-than-expected revenue in the first quarter on strong international demand for its snacks and beverages.
Kroger, Albertsons Agree to Divest More Stores
Kroger Co. and Albertsons Cos. agreed to divest more stores to C&S Wholesale Grocers, seeking to make their planned $24.6 billion merger more appealing to antitrust authorities.
Amazon Prime Memberships in US Gain 8% to New High
Amazon.com Inc.’s Prime subscription service hit a new high of 180 million U.S. shoppers in March, up 8% from a year earlier, according to Consumer Intelligence Research Partners.
Amazon Eyes Record High
Wall Street investors are finally doing what analysts have been recommending all along: buying Amazon.com Inc.
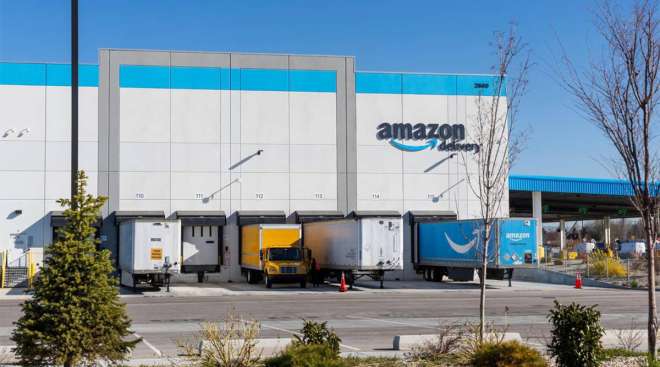
Inside an Amazon Last-Mile Delivery Station

Take a look inside one of Amazon's newest delivery stations, where 40,000 to 50,000 packages a day are sorted and handed off to drivers to take them to their final destination.
Lawmakers Urge FTC to Take Action on Grocery Profits

A group of lawmakers wants the FTC to take action against large retailers, such as Amazon and Walmart, that increased profits during the COVID-19 pandemic and have kept prices high since.
Kroger Closing Three E-Commerce Facilities in Texas, Florida
NEW YORK — Kroger is shuttering three spoke facilities in its Texas and Florida e-commerce operations, the grocery chain confirmed this week.
March 28, 2024Home Depot Buys SRS Distribution in $18 Billion Deal
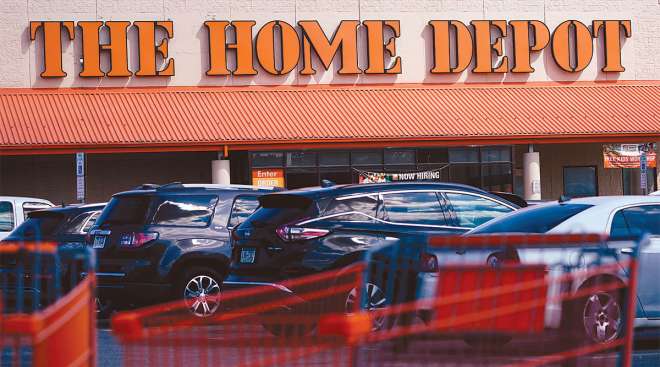
Home Depot will buy SRS Distribution, a materials provider for professionals, in a deal valued at approximately $18.25 billion.
Big Grocers Profited From Pandemic More Than Smaller Rivals
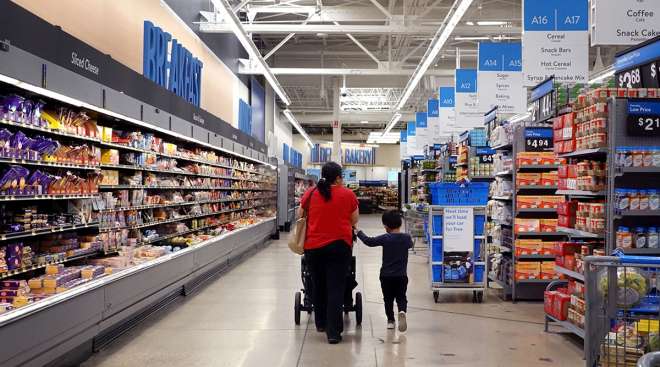
Large grocery retailers’ annual profits rose during the COVID-19 pandemic and have remained elevated since, which warrants deeper scrutiny, says a report by the Federal Trade Commission.
Amazon Reports ‘Measurable Progress’ on Worker Safety
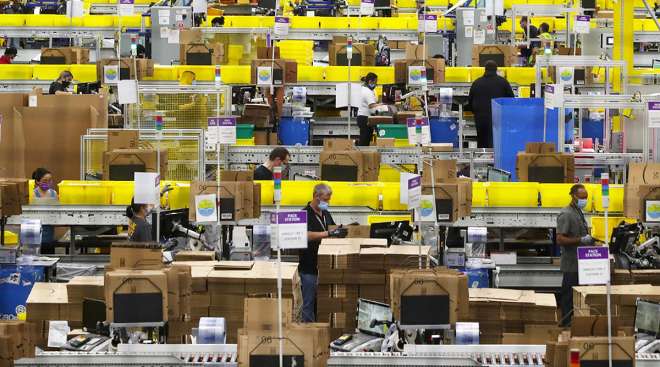
Amazon’s safety data shows a decline in its warehouse injury rate in 2023, marking an improvement for the second consecutive year, but critics disagree with how the company measures safety.
-

2022
-
2021
-
2020
-
2019
-
2018
-
2017
-
2016
-
2015
-
2014
-
2013
-
2012
-
2011
-
2010
-
2009
-
2008
-
2007
-
2006
-
2005
-
2004


