


| Rank This Year | Rank Last Year | Company | Revenue (000) | Net Income (000) | Employees | Tractors* | Trailers |
|---|---|---|---|---|---|---|---|
| 1 | 1 | UPS Inc.
|
74,094,000 | 4,440,000 | 495,000 | 19,851 | 107,542 |
| 2 | 2 | FedEx Corp.
|
68,869,000 | 2,359,000 | 475,000 | 29,813 | 113,218 |
| 3 | 3 | XPO
|
16,648,000 | 379,000 | 100,000 | 15,500 | 40,000 |
| 4 | 4 | J.B. Hunt Transport Services
|
9,165,258 | 516,000 | 29,106 | 17,972 | 35,093 |
| 5 | 7 | Schneider
|
5,000,000 | 147,000 | 15,650 | 9,000 | 35,100 |
| 6 | 6 | Yellow Corp.
|
4,871,200 | -104,000 | 30,000 | 14,100 | 43,700 |
| 7 | 5 | Knight-Swift Transportation Holdings
|
4,843,950 | 310,178 | 23,800 | 19,520 | 58,315 |
| 8 | 9 | Old Dominion Freight Line
|
4,109,111 | 615,518 | 21,159 | 9,296 | 37,539 |
| 9 | 8 | Landstar System
|
4,084,577 | 227,720 | 1,333 | 10,243 | 17,067 |
| 10 | 11 | Ryder Supply Chain Solutions
|
3,968,754 | 226,209 | |||
| 11 | 10 | TFI International
|
3,903,828 | 233,891 | 16,700 | 15,844 | 25,505 |
| 12 | 12 | Hub Group
|
3,668,117 | 107,171 | 5,000 | 3,900 | 4,920 |
| 13 | 13 | Estes Express Lines
|
3,260,000 | - | 19,000 | 7,485 | 38,617 |
| 14 | 14 | ArcBest
|
2,988,310 | 39,985 | 13,000 | 4,137 | 23,639 |
| 15 | 16 | Penske Logistics
|
2,600,000 | - | 19,475 | 4,634 | 17,626 |
| 16 | 15 | Werner Enterprises
|
2,463,701 | 166,944 | 12,736 | 8,033 | 24,145 |
| 17 | 18 | Prime Inc.
|
2,288,397 | 307,504 | 4,900 | 7,416 | 14,116 |
| 18 | 19 | NFI
|
2,140,000 | - | 12,600 | 4,550 | 12,500 |
| 19 | 23 | R+L Carriers
|
1,972,000 | - | |||
| 20 | 17 | Roadrunner Freight
|
1,847,862 | -340,937 | 3,600 | ||
| 21 | 25 | Saia Inc.
|
1,786,735 | 113,719 | 10,400 | 4,779 | 16,376 |
| 22 | 27 | Kenan Advantage Group
|
1,758,645 | - | 9,400 | 6,977 | 11,225 |
| 23 | 21 | Daseke Inc.
|
1,737,000 | -307,400 | 5,946 | 2,334 | |
| 24 | 20 | U.S. Xpress Enterprises
|
1,707,361 | -3,043 | 8,572 | 6,900 | 15,500 |
| 25 | 24 | CRST The Transportation Solution
|
1,559,000 | - | 6,778 | 5,808 | 14,513 |
| 26 | 26 | C.R. England
|
1,545,199 | - | 8,153 | 4,309 | 6,604 |
| 27 | 28 | Universal Logistics Holdings
|
1,511,998 | 37,586 | 6,541 | 5,343 | 4,428 |
| 28 | 22 | UniGroup
|
1,500,000 | - | |||
| 29 | 31 | Forward Air
|
1,410,395 | 87,099 | 5,652 | 1,353 | 7,178 |
| 30 | 29 | Sirva Inc.
|
1,400,000 | - | |||
| 31 | 30 | Southeastern Freight Lines
|
1,384,438 | - | 8,839 | 3,385 | 10,666 |
| 32 | 32 | Averitt Express
|
1,319,000 | - | 9,007 | 5,319 | 14,905 |
| 33 | 33 | Anderson Trucking Service
|
1,274,459 | - | 2,294 | 2,780 | 7,209 |
| 34 | 34 | Evans Delivery
|
1,240,000 | - | 430 | 6,200 | 550 |
| 35 | 35 | Crete Carrier Corp.
|
1,200,000 | - | 6,500 | ||
| 36 | 36 | Purolator
|
1,166,279 | - | 11,000 | 465 | 1,329 |
| 37 | 46 | Day & Ross
|
1,130,700 | - | 5,000 | 4,000 | 8,000 |
| 38 | 45 | Quality Carriers
|
1,090,684 | - | |||
| 39 | 37 | Lynden
|
1,075,000 | - | 3,039 | 998 | 2,679 |
| 40 | 39 | Ruan
|
1,002,045 | - | 5,900 | 3,704 | 9,661 |
| 41 | 40 | KLLM Transport Services
|
936,000 | - | 3,600 | 5,400 | |
| 42 | 41 | Atlas World Group
|
906,400 | 96,000 | 754 | 1,228 | 3,864 |
| 43 | 42 | Covenant Logistics Group
|
894,528 | 8,477 | 5,550 | 3,021 | 6,739 |
| 44 | 44 | Central Transport International
|
856,000 | - | |||
| 45 | 43 | Pitt Ohio Transportation Group
|
855,982 | - | 5,680 | 2,055 | 5,836 |
| 46 | 48 | Marten Transport
|
843,271 | 61,071 | 4,087 | 3,212 | 5,464 |
| 47 | 47 | Cardinal Logistics
|
805,000 | - | 4,220 | 3,055 | 8,700 |
| 48 | 49 | PS Logistics
|
747,339 | - | 3,664 | ||
| 49 | 51 | Stevens Transport
|
737,294 | 85,210 | 2,750 | 1,950 | 3,290 |
| 50 | 50 | AAA Cooper Transportation
|
718,000 | - | 5,000 | 2,552 | 6,958 |
| 51 | 54 | United Road Services
|
713,000 | - | 1,837 | 2,368 | 1,200 |
| 52 | 52 | Western Express
|
683,535 | - | 3,250 | 3,050 | 8,080 |
| 53 | 54 | Dayton Freight Lines
|
679,000 | - | 4,949 | 1,955 | 4,600 |
| 54 | 53 | Mullen Group
|
664,550 | - | 3,768 | 1,978 | 5,139 |
| 55 | 56 | Bennett International Group
|
650,846 | - | 1,029 | 1,810 | 2,186 |
| 56 | 62 | Bison Transport
|
633,817 | - | 3,688 | 2,185 | 5,711 |
| 57 | 61 | OnTrac Inc.
|
618,000 | - | |||
| 58 | 66 | Trimac Transportation
|
610,000 | - | 3,000 | 2,120 | 3,400 |
| 59 | 59 | Suddath
|
600,000 | - | 2,200 | ||
| 60 | 57 | Heartland Express
|
596,815 | 72,967 | 4,050 | 2,630 | 8,000 |
| 61 | 69 | Black Horse Carriers
|
561,000 | - | 4,040 | 1,958 | 4,500 |
| 62 | 73 | Hirschbach Motor Lines
|
550,530 | - | 1,141 | 1,887 | 3,503 |
| 63 | 58 | Mercer Transportation Co.
|
543,651 | - | 301 | 2,383 | 2,600 |
| 64 | 67 | Canada Cartage System
|
535,800 | 5,800 | 3,269 | 2,736 | 3,019 |
| 65 | 63 | Cowan Systems
|
533,012 | - | 2,397 | 2,279 | 6,782 |
| 66 | 70 | Two Men and a Truck Movers
|
524,929 | - | 11,396 | ||
| 67 | 64 | USA Truck (DB Schenker)
|
522,631 | -4,698 | 2,098 | 1,990 | 6,092 |
| 68 | 65 | P.A.M. Transport
|
514,177 | 7,900 | 2,666 | 2,130 | 7,081 |
| 69 | 60 | Jack Cooper Holdings
|
507,000 | - | 3,753 | ||
| 70 | 75 | A. Duie Pyle Inc.
|
491,100 | - | 3,281 | 1,209 | 2,285 |
| 71 | 74 | LaserShip Inc./OnTrac Inc.
|
452,000 | - | |||
| 72 | 72 | TMC Transportation
|
450,000 | - | |||
| 73 | 76 | Roehl Transport
|
438,659 | - | 2,702 | 2,040 | 5,481 |
| 74 | 68 | Dart Transit Co.
|
424,000 | - | 2,362 | ||
| 75 | 71 | 10 Roads Express
|
390,445 | - | |||
| 76 | 77 | Maverick USA
|
389,182 | - | 2,125 | 1,582 | 2,582 |
| 77 | 78 | Transport Investments
|
384,719 | - | 200 | ||
| 78 | 79 | Mesilla Valley Transportation
|
383,950 | - | 1,662 | ||
| 79 | 83 | Koch Cos.
|
351,081 | - | 1,224 | 1,164 | 5,540 |
| 80 | 80 | IMC Cos.
|
347,395 | - | 2,012 | ||
| 81 | 81 | Red Classic
|
342,100 | - | 1,275 | 577 | 2,918 |
| 82 | Salmon Cos.
|
341,073 | - | 824 | 1,104 | ||
| 83 | 89 | John Christner Trucking
|
338,873 | - | 207 | 839 | 1,244 |
| 84 | 95 | Challenger Motor Freight
|
335,000 | - | 1,200 | 1,570 | 3,550 |
| 85 | 82 | Foodliner/Quest Liner
|
334,103 | - | 1,315 | 1,317 | 2,340 |
| 86 | 86 | RoadOne IntermodaLogistics
|
314,000 | - | 2,200 | 1,700 | 350 |
| 87 | 85 | Melton Truck Lines
|
305,717 | - | 1,868 | 1,457 | 2,407 |
| 88 | Fastfrate Group
|
301,520 | - | 1,530 | 1,116 | 1,350 | |
| 89 | 86 | ContainerPort Group
|
300,000 | - | 400 | ||
| 90 | Dupré Logistics
|
297,582 | - | 1,313 | 750 | 1,471 | |
| 91 | 84 | TransAm Trucking
|
297,000 | - | |||
| 92 | 90 | Heniff Transportation Systems
|
293,000 | - | |||
| 93 | 86 | Trans-System Inc.
|
290,000 | - | 1,051 | 1,026 | 1,849 |
| 94 | 93 | Hansen & Adkins Auto Transport
|
283,137 | 6,622 | 955 | 1,224 | 945 |
| 95 | 97 | Martin Transportation Systems
|
276,978 | - | 2,357 | 1,264 | 2,417 |
| 96 | 95 | Quantix Supply Chain Solutions
|
276,000 | - | 1,100 | ||
| 97 | FFE Transportation Services
|
275,000 | - | 1,511 | 1,000 | 1,450 | |
| 98 | 98 | PGT Trucking
|
273,828 | - | 680 | 1,090 | 1,800 |
| 99 | Groendyke Transport
|
273,125 | - | ||||
| 100 | 99 | Superior Bulk Logistics
|
269,000 | - |
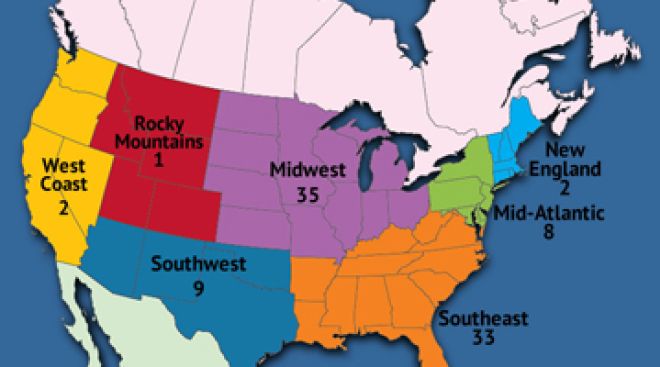
Top For-Hire Carriers on this list are common and contract freight carriers operating in the United States, Canada and Mexico. Companies are ranked on the basis of annual revenue. To be included in the Top 100 or any of the sectors, please send contact information to tteditor@ttnews.com. We will contact you via phone or e-mail to get information about your company prior to publication of the next Top 100 list.
* Tractor count includes company-owned, lease-to-own and owner-operator tractors.
On the Bubble


Five Auto Haulers to Merge as Backer Files for IPO
Five auto carriers look set to merge, with the combined entity likely to then add to its assets by buying up competitors, if an initial public offering pans out as planned.
J.B. Hunt Reports $2.9 Billion Revenue for Q1
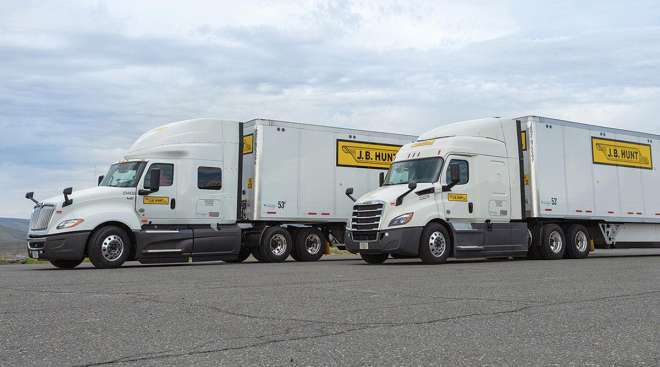
J.B. Hunt Transport Services Inc. experienced a decline in revenue and earnings during the first quarter of 2024, the company reported April 16.
Truck Software Developer Platform Science Raises $125M
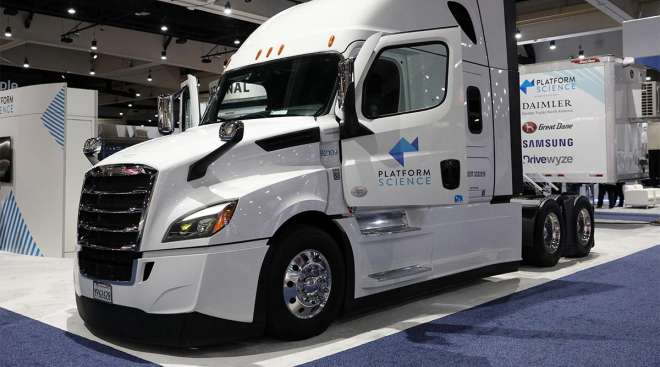
Platform Science raised $125 million in capital to accelerate the launch of its software platform with additional truck manufacturers, a spokesperson for the company said April 16.
Amazon Becomes the Largest US Private EV Charging Operator
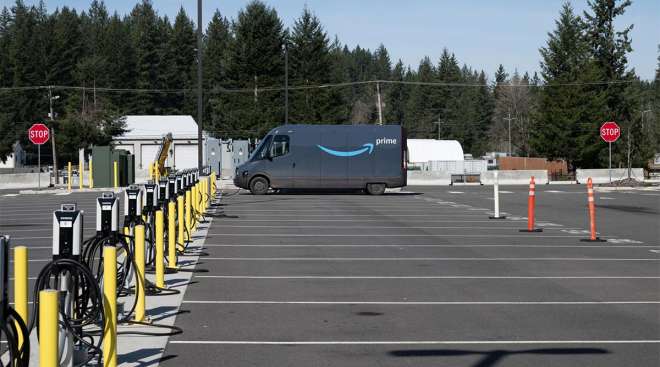
Amazon has installed more than 17,000 chargers at about 120 warehouses around the U.S., making the retail giant the largest operator of private EV charging infrastructure in the country.
Kenan Advantage Group Owner Omers Exploring IPO
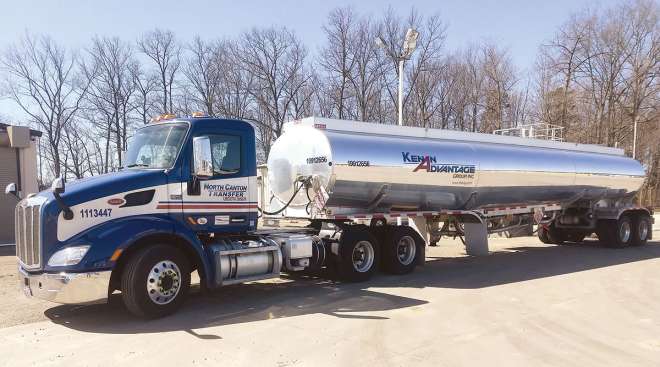
Omers Private Equity is exploring an initial public offering of Kenan Advantage Group, one of North America’s biggest tank truck transporter and logistics providers, according to sources.
Roadrunner Opens Service Center in Atlanta
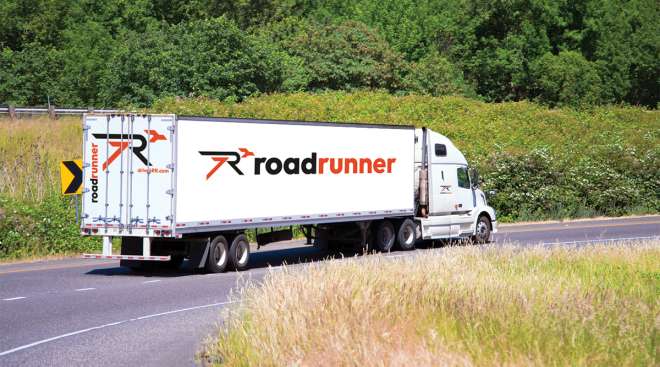
Roadrunner opened a new less-than-truckload service center in Atlanta, the longhaul freight carrier announced April 10.
Kodiak Forms Autonomous Truck Council With Walmart, UPS
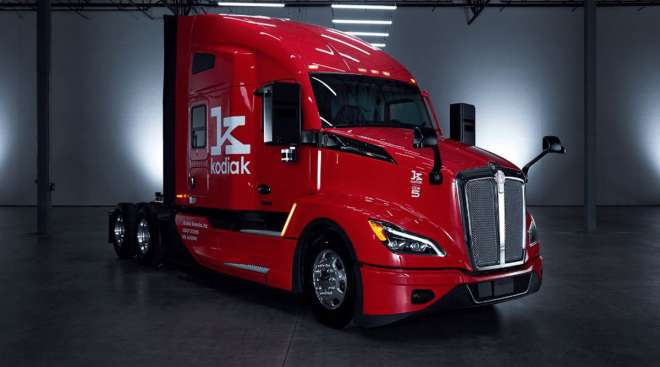
Kodiak Robotics launched an advisory council to bolster its efforts to commercialize autonomous trucks with the help of trucking industry leaders, the company announced March 27.
Penske Sues Sacramento Over Environmental Plan
Penske Truck Leasing Co. has sued the city of Sacramento, Calif., alleging the city's environmental plan will harm the company's large North Sacramento facility.
UPS to Become the Primary Air Cargo Provider for USPS
UPS will become the primary air cargo provider for the United States Postal Service after FedEx said it wasn’t able to reach an agreement on mutually beneficial terms to extend its contract.
Work Continues on Establishing PC-12 Oil Category

PC-12 will replace the current API CK-4 and FA-4 engine oils, but there are still hurdles ahead of the finish line.
-

2022
-
2021
-
2020
-
2019
-
2018
-
2017
-
2016
-
2015
-
2014
-
2013
-
2012
-
2011
-
2010
-
2009
-
2008
-
2007
-
2006
-
2005
-
2004


