Top 100 Truck Bottlenecks: Texas Tops 2019 ATRI List With 13

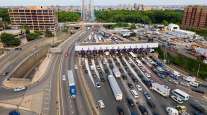
The passage to the George Washington Bridge on the New Jersey side of the Hudson River has once again been named the country’s worst bottleneck for trucks.
The intersection — at Interstate 95 and state Route 4 in Fort Lee — returned to the top spot on the American Transportation Research Institute’s truck bottlenecks report, unveiled Feb. 12, after a hiatus; it last topped the list in 2014. The full Top 10:
| Rank | City | Intersection |
| 1. | Fort Lee, N.J. | I-95 at SR 4 |
| 2. | Atlanta | I-285 at I-85 (North) |
| 3. | Atlanta | I-75 at I-285 (North) |
| 4. | Los Angeles | SR 60 at SR 57 |
| 5. | Houston | I-45 at I-69/US 59 |
| 6. | Cincinnati | I-71 at I-75 |
| 7. | Chicago | I-290 at I-90/I-94 |
| 8. | Nashville, Tenn. | I-24/I-40 at I-440 (East) |
| 9. | Atlanta | I-20 at I-285 (West) |
| 10. | Los Angeles | I-710 at I-105 |
“Since we began doing this in 2011, there are just three of the bottlenecks that have been in that No. 1 spot: Fort Lee, the Atlanta location ‘Spaghetti Junction’ and the Byrne Interchange in Chicago,” ATRI President Rebecca Brewster said.
The North Jersey corridor was followed by last year’s worst bottleneck, Atlanta’s five-level stack interchange, “Spaghetti Junction,” where interstates 285 and 85 North intersect.
The third spot also was in Atlanta: I-75 at I-285 North. The rest of the top 10 in descending order were Los Angeles’ state Route 60 at state Route 57, Houston’s I-45 at I-69/US 59, Cincinnati’s I-71 at I-75, Chicago’s I-290 at I-90/I-94, Nashville’s I-24/I-40 at I-440 East, Atlanta’s I-20 at I-285 West, and Los Angeles’ I-710 at I-105.
A growing rate of congestion along freight corridors led to a reduction of year-over-year speeds by an average of nearly 9% at the interchanges in the top 10, according to ATRI.
“While our list focuses on truck-based congestion, in every one of these locations it is not that just trucks are moving so slowly, cars are impacted by this congestion as well,” Brewster said.
With 13 sites, Texas was the state with the most truck bottlenecks. The report named the top 100 bottlenecks for truck traffic.
The report relied on GPS data recorded from nearly a million heavy-duty trucks, as well as terabytes of data from trucking operations. The data supports the U.S. Department of Transportation’s freight mobility initiatives.
“The ranking is based on both [truck] volume and speed,” Brewster said.
Overall, congestion led to an annual cost to the trucking industry of $74.5 billion in 2016, ATRI determined. The impact from congestion resulted in an estimated 1.2 billion lost hours of productivity.
“It is the equivalent of over 425,000 truck drivers sitting still for an entire year,” she said.
“ATRI’s research shows us where the worst pain points are — but they are far from the only ones,” American Trucking Associations President Chris Spear said. “This report should be a wake-up call for elected leaders at all levels of government that we must act quickly to address our increasingly congested highway system.
“Without meaningful investment in our nation’s infrastructure, carriers will continue to endure billions of dollars in congestion-related costs — which results in a self-inflicted drag on our economy.”
ATRI Bottlenecks Brochure 2019 by on Scribd
UPS Freight President Rich McArdle emphasized congestion negatively affects freight mobility. Last week, he urged congressional policymakers to advance legislation that would help improve freight connectivity.
“For UPS, if all of our vehicles are delayed just five minutes a day, every day, it costs our company $114 million a year. In order to combat congestion, many companies must plan operational redundancies to meet their customer needs,” McArdle said. “Using data like ATRI’s bottleneck report can help both companies and elected officials to make more informed decisions.”
Strategically allocated infrastructure funding has proved to significantly impact truck congestion. The Jane Byrne Interchange in Chicago is an example of how construction initiatives help.
“The state of Illinois issued a press release indicating that they were going to redesign that interchange because they no longer wanted to have the No. 1 freight bottleneck in the country,” Brewster said.
Since construction has started, the site has dropped to No. 7.
Brewster is confident that once construction is complete the location will fall further down the list.
“[ATRI’s report] gives state DOTs the information they need to say and identify that this is a place where we need to do work,” Brewster said.
Last year, in Louisville, Ky., the I-65 at I-64/I-71 interchange ranked No. 10. This year, the site is not in the top 100. Brewster noted that the change in congestion is due to infrastructure funding that alleviated the bottleneck.
The North Jersey corridor had topped the list in 2014. Of the 47.1 million vehicles to travel across the bridge last year, 3.4 million were trucks, according to the Port Authority of New York and New Jersey. The bridge connects Bergen County with the Washington Heights neighborhood of Manhattan. Trucks are prohibited from traveling on the bridge’s lower level.