New-Home Sales Cool, Supply Jumps as Storms Strike South

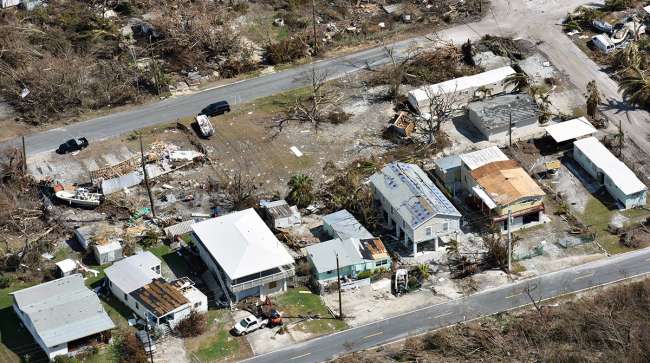
A second straight decline in purchases of new U.S. homes, combined with downward revisions for prior months, show a tepid market as results begin to be clouded by the fallout from Hurricanes Harvey and Irma, according to government data Sept. 26.
Highlights of August New Home Sales
• Single-family home sales fell 3.4% month over month to 560,000 annualized pace (est. 585,000) after 580,000 rate (revised from 571,000).
• Supply of homes at current sales rate rose to 6.1 months, highest since July 2014; 284,000 new houses were on market at end of August, most since May 2009.
• Purchases fell in three of four U.S. regions, led by a 4.7% decrease in the South; unchanged in Midwest
Key Takeaways
While data aren’t available at the state or local level, areas in Texas and Florida affected by Harvey and Irma accounted for about 14% of single-family housing units authorized by permits in 2016, the Census Bureau said in a special notice. If no sales information is received by the government, the units’ status is assumed to be unchanged.
It may be hard to get a clear read on the market’s underlying trends in the next few months as economic data become volatile thanks to three major hurricanes: Harvey in southeast Texas in late August, Irma in Florida in early September, and Maria in Puerto Rico last week.
Even without the impact of the storms, rising prices were crimping affordability, especially for younger, first-time buyers who also find it harder to get credit. At the same time, steady hiring and low borrowing costs are likely to keep underpinning demand in what’s been a gradual housing recovery.
New-home sales, tabulated when contracts get signed, account for about 10% of the market. They’re considered a timelier barometer than purchases of previously owned homes, which are calculated when contracts close and are reported by the National Association of Realtors.
Other Details
• Median sales price increased 0.4% year over year to $300,200.
• Net revision for May-July reduced home sales by 19,000.
• Government corrects sales prices for October 2014 to January 2017 to include additional data; monthly median and average prices revised downward about 1.2% on average.
• Report said there was 90% confidence that the change in sales last month ranged from a 16.4% drop to a 9.6% increase, underscoring the volatility of the data.
• Report released jointly by the Census Bureau and Department of Housing and Urban Development in Washington.
With assistance by Chris Middleton


