


The Impact of Video-Based Safety

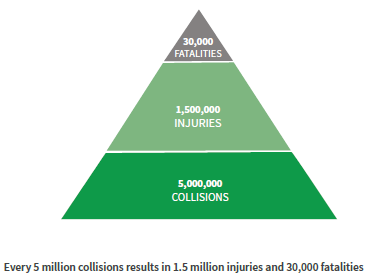
Every mile on the road exposes fleets, vehicles and drivers to the risk of having a collision. A comprehensive National Highway Traffic Safety Administration (NHTSA) study1 has shown that inattention, excessive speed, failure to yield and unsafe lane changes are among the top causes of truck collisions. In general, driver-related factors contribute to 88%1 of large truck collisions and 95%2 of light passenger vehicle collisions, indicating that most of the 30,000 fatalities, 1,500,000 injuries, and 5,000,000 collisions that occur on the road in the United States each year3 are preventable.
However, preventing collisions caused by drivers is challenging because driver-related risk factors must be measured on the roadway (before a collision occurs) and those factors must be addressed in a timely manner.
But, how do you know what risks your drivers may be taking on the road– when you’re not on the road with them? It’s even more difficult when you are managing a fleet with hundreds of drivers across the country 24 hours a day, 7 days a week. With an 8% increase in large truck and bus fatality crashes4, it’s more important than ever for fleets to know what’s going on in the cab. Video is proving to be the only way to truly know.
A fleet’s collision frequency largely depends on the skills and abilities of its drivers. Results from naturalistic driver studies5-6 that utilize video recordings of drivers on the road to investigate the root causes of safety critical events, suggest a common pattern: the 20% riskiest drivers are individually about 3.9 to 4.9 times more risky7 than the other 80% of drivers.
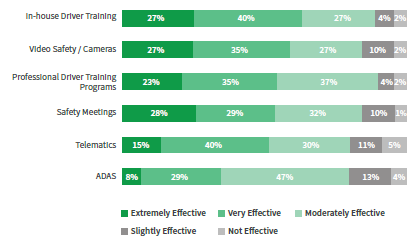
In a recent survey, more than 60% of fleets found video-based safety extremely effective or very effective in helping to improve the safety of their fleet. The only category to surpass video-based safety was in-house training, which is something all fleets should do as a foundation for their safety program, regardless of technology investment. As well, 98% of all fleets that install a video-based safety system continue benefiting from the service and value they receive – long after the first year of installment. The reason, in many cases, is due to savings resulting from driver exonerations. Nearly 70% of fleets using a video-based safety system find exonerations the biggest benefit of this type of solution. Reinforcing this fact, many fleets state that the litigation savings from one collision pay for the cost of the service for the entire fleet for one year.
In addition to exonerations, improved driver performance and decreased claims process time, many fleets achieve additional benefits they never expected when they installed the system. Maybe that’s why nearly 40% of respondents who don’t have a video-based safety program are actively considering video.
As more and more fleets move toward video-based safety, it’s important to understand the impact of protecting your drivers, your fleet and your company. Fleet safety is more than numbers and the bottom line. Fleet safety is about saving lives.
To read the entire survey and get other invaluable resources to help make your fleet safer, click here.

About SmartDrive Systems
SmartDrive Systems, the recipient of Frost & Sullivan’s Customer Value Leadership Award for Video Safety Solutions, gives fleets and drivers unprecedented driving performance insight and analysis, helping save fuel, expenses and lives. Its video analysis, predictive analytics and personalized performance program help fleets improve driving skills, lower operating costs and deliver significant ROI. With an easy-to-use managed service, fleets and drivers can access and self-manage driving performance anytime, anywhere. The company, which is ranked as one of the fastest growing companies by Deloitte’s Technology Fast 500™, has compiled the world’s largest storehouse of more than 195 million analyzed risky-driving events. SmartDrive Systems is based in San Diego, Calif., and employs over 650 people worldwide.
Sources:
1 M. Starnes, "Large-Truck Crash Causation Study: An Initial Overview," National Highway Traffic Safety Administration, vol. DOT HS 810 646, #aug# 2006.
2 "National Motor Vehicle Crash Causation Survey," National Highway Traffic Safety Administration, vol. DOT HS 811 059, #jul# 2008.
3 "Traffic Safety Facts 2012," National Highway Traffic Safety Administration, vol. DOT HS 812 032, 2012.
4 FMCSA Large Truck and Bus Crash Facts, https://www.fmcsa.dot.gov/safety/data-andstatistics/large-truck-and-bus-crash-facts
5 J. S. Hickman, R. R. Knipling, R. L. Olson, M. C. Fumero, M. Blanco and R. J. Hanowski, "Phase I: Preliminary analysis of data collected in the drowsy driver warning system field operational test: Task 5: Preliminary analysis of drowsy driver warning system field operational tests data," Virginia Tech Transportation Institute, Vols. NHSTA Contract No. DTNH22-00-C-07007, 2005.
6 R. R. Knipling, R. J. Hanowski, J. S. Hickman, R. L. Olson, T. A. Dingus and R. J. Carroll, "Exposure-Risk Analysis of Large Truck Naturalistic Driving Data," 2005.
7R. J. Hanowski, W. W. Wierwille, S. A. Garness and T. A. Dingus, "Impact of LocalShort Haul Operations on Driver Fatigue. Final Report," FMCSA, Vols. DOT-MC-00-203, #sep# 2000.