ATA April Tonnage Falls 1.8%; Other Freight Indexes Brighter
This story appears in the May 29 print edition of Transport Topics.
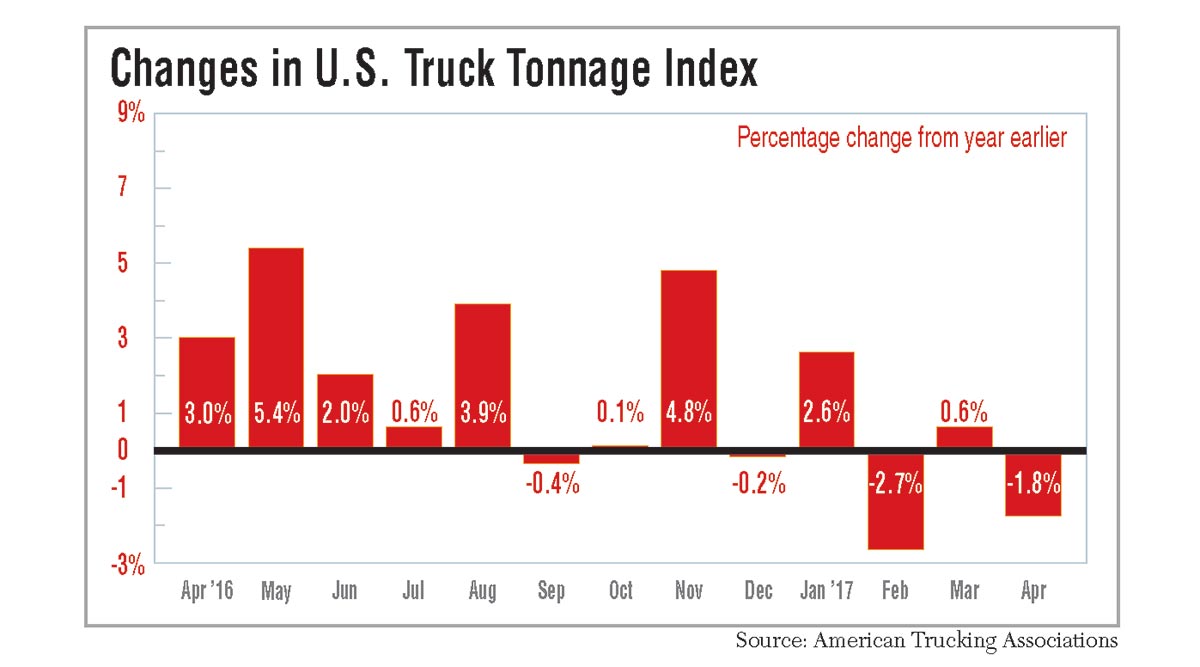
Truck tonnage fell 1.8% year-over-year in April even though fleets generally reported positive conditions for the month, according to the latest monthly data from American Trucking Associations.
“I have to admit that April’s contraction is a bit surprising, especially considering the anecdotal reports I’ve been hearing from fleets regarding freight levels,” said Bob Costello, the federation’s chief economist. “It’s not necessarily that tonnage levels fell in April that is surprising but the size of the decrease.”
On a sequential basis, the seasonally adjusted index slipped 2.5% to 134 in April from 137.4 in March.
The index uses a base level of 100 for freight activity in the year 2000. The all-time high was in February 2016 at 142.7.
The not seasonally adjusted index, which represents the change in tonnage actually hauled by the fleets, was 132.6 in April, which was 7.8% below the March level.
However, the Morgan Stanley Truckload Freight Index, which measures supply and demand, found that dry-van and reefer conditions were better than last year and on par with 2015. Flatbed activity was significantly stronger than 2015 and 2016. Morgan Stanley analyst Ravi Shanker added in a May 24 truckload sentiment survey report that he was “a bit surprised, given the positive soft data we have been seeing.”
Nevertheless, Shanker told Transport Topics that the optimism from Election Day doesn’t appear to have translated into robust spending yet. He said many businesses are bewildered and frustrated with waiting for optimism to turn into action, speci- fically on consumer spending.
ACT Research Co.’s For-Hire Trucking Index fell in April on a sequential basis but was better than the levels during the same month in 2016. The index is derived from a survey of trucking companies, and 50 is the dividing line between expanding or contracting economic conditions.
The volume index was 61 in April versus 71.1 in March and 46.3 in April 2016. The pricing index was 59.6 versus 64.8 in March and 48.1 in April 2016. The capacity index was 54.4 versus 54.7 and 53.8. The productivity index was 52.9 versus 61.7 in March and 45 in April 2016.
Jim Meil, principal for industry analysis at ACT Research, said that the data correspond to positive indicators in the economy, particularly in flatbed freight.
“The manufacturing sector is showing some good numbers. Industrial production and the purchasing managers index are pretty good. Capital goods and machinery numbers are improving, too. The energy sector is also coming back,” he said.
Meil described the mood as “better, but not good” because more trucks remain available than freight, tipping the supply-and- demand curve away from carriers.
“For example, the pricing numbers are pretty good, but in 2014, a very good year for carriers, every month had an index reading between 60.9 and 68.8. So we’re in a better environment than last year, but it’s still an early stage, and some will still wonder whether it’s noise or the real deal,” he said.
The DAT North American Freight Index dropped 2.5% in April, but volume remained above seasonal norms.
Average spot truckload rates rose last month for vans, refrigerated and flatbed freight sequentially and year-over-year.
“It’s not unusual for truckload freight activity to give ground in April, but national average load-to-truck ratios and rates last month were higher than expected,” said Mark Montague, DAT industry pricing analyst.
The national average load-to-truck ratio was up 8% month-over-month and rose 127% versus last year. The load-to-truck ratio measures the number of available loads for every truck posted on the load board.
The national average spot rate was $1.67 per mile for vans, including fuel surcharges, which is 17 cents higher than April 2016.
Reefer demand declined 5.4% sequentially but improved 87% compared with a year ago. At $1.94 per mile, the average spot reefer rate was 14 cents higher year-over-year.
Flatbed demand was virtually unchanged sequentially but rose 43% from the same month last year. The average rate of $2.07 per mile was 17 cents higher than April 2016.
In other economic news, the Institute for Supply Management reported the Purchasing Managers Index dropped to 54.8% from 57.2% in March. The index measures new orders, inventory levels, production, supplier deliveries and employment. The Federal Reserve’s Industrial Production Index rose to 105.1 compared with 104.1 in March and 102.9 in April 2016. The U.S. Census Bureau announced retail sales improved 0.4% sequentially and 4.5% year-over-over in April, but the inventory- to-sales ratio remained unchanged for the fourth consecutive month at 1.35 for March, the latest month of available data.
New home construction on a seasonally adjusted annual basis dropped 2.6% sequentially to 1.2 million in April, but it remained 0.7% higher year-over-year. Costello cited the housing data as a potential cause for the drop in tonnage because, he said, the sector generates heavier truck freight.
“Despite the fact that tonnage is down a total of 3.6% over the last three months, I still expect moderate growth going forward as key sectors of the economy continue to improve slowly,” Costello added.